1Department of Anatomy, Faculty of Medicine, Masaryk University, Brno, Czech Republic
2Brno University of Technology, Faculty of Mechanical Engineering, Department of Reverse Engineering and Additive Technologies, Brno, Czech Republic
3Brno University of Technology, Faculty of Chemistry, Institute of Physical and Applied Chemistry, Brno, Czech Republic
4Department of Animal Anatomy, Histology, and Pathomorphology, National University of Life and Environmental Sciences of Ukraine, Kiev, Ukraine
5Department of Human Anatomy National Pirogov Memorial Medical University, Vinnytsya, Ukraine
The condition and possible changes of soft tissues in bodies which have been fixed for long periods of time can be monitored by contactless objective measurement of color, volume, and surface changes of the soft tissues and skin. Changes in the tissues of bodies fixed for long periods of time occur due to the action of internal and external factors such as UV radiation, which causes the destruction of melanin in epidermal cells. Pioneering development of contactless monitoring methods began in the 1960s by a Moscow laboratory which was a part of the Mausoleum of V.I. Lenin, now the All-Russian Research Institute of Medicinal and Aromatic Plants. In this communication, the authors present methods, devices, and software which are nowadays commonly available for the purposes of contactless monitoring in case of tissue changes. Some bodies found during archaeological research can also fall into this category in cases where they were well preserved due to specific conditions (low temperatures or anaerobic conditions). Some mummies can also have soft tissues well preserved. To evaluate their condition and ongoing changes, it is necessary to perform the following analyses: photo documentation, CT scanning, 3D surface scanning, colorimetry, and various microbiological, microscopic, biochemical, and chemical analyses. Once the state of the analyzed body is established using such contactless methods or methods with minimal invasiveness, it is then possible to perform regular body care and monitoring.
embalmed body; cadaver; postmortem; storage; contactless monitoring
Jan Frišhons, Department of Anatomy, Faculty of Medicine, Masaryk University, Kamenice 126/3, 625 00, Brno, Czech Republic, telephone: +420 54949 6418, jan.frishons@fnusa.cz

![]()


There are few cases where bodies have been preserved for long time periods, and whose soft tissues are in good condition. Most of them are the bodies of political leaders or famous persons such as Professor N.I. Pirogov (Frišhons et al., 2020). Basic contactless methods include the monitoring of the volume and surface of the skin using stereophotography, photogrammetry, or colorimetric examination of the skin color at the areas of interest. Changes in tissue volume may occur due to oxidative or hydrolytic processes in the subcutaneous fat. At present, it is also possible to use, for example, 3D scanning, or reconstruction of data from CT examinations, to determine the condition of the skeleton and soft tissues. If the body is stored in a tightly closed sarcophagus or coffin exposed to permanent lighting, it is advisable to monitor the light intensity and the parts of the body which are exposed to the light.
The light reflected by a physical object can be quantitatively and qualitatively characterized by its dominant wavelength, the relative magnitude of the reflectance in the region of the dominant wavelength relative to other parts of the spectrum, and the absolute intensity of the reflected radiation. These physical attributes correspond to the psychophysical attributes of the perceived color called hue, saturation, and brightness, and the color thus appears as a three-component attribute. In practice, it is convenient to convert the results of spectral measurements (reflectance curves) into colorimetric coordinates by a suitable mathematical model, because these allow a more intuitive and objective comparison and assessment of chromaticity. Three components then enter into the calculation of colorimetric coordinates: the emission spectrum of the source (one of the so-called standard illuminants), the reflectance spectrum of the object, and the observer's properties, which are described by three so-called color matching functions x, y, z. Basic tristimulus values X, Y, Z are obtained as a spectral product.
The calculated values are further transformed into suitable color spaces (a specific organization of colors), which enable visualization and objective evaluation of color. The space Yxy, where x and y coordinates are obtained by a simple normalization of the values X, Y, Z and which is visualized as a so-called chromatic diagram, was adopted as the basic, and historically the first, color space in the 1930s. Its disadvantage is the disproportionality, which is manifested by the fact that the geometric distance of the two coordinates of the compared samples does not correspond to the degree of visually perceived difference. After several more or less unsuccessful attempts to design color spaces that would not suffer from this disproportionality, the space L* a* b* was later defined and widely accepted, where the luminance component L* and chromatic components a*, b* were obtained by nonlinear transformation of the values X, Y, Z. Thus, the space obtained is far more uniform and proportional, i.e., the geometric distance of the two points being compared in such space more or less corresponds to the degree of subjectively felt deviation between the color samples in the whole volume of this space.
In the CIELAB system, the L* coordinate represents the brightness, it is graphically expressed on the x-axis, and it takes values from 0 (black) to 100 (white). The coordinate a* is graphically on the y-axis, where it changes from positive values (red) to negative values (green). The coordinate b* is graphically on the z axis, where it changes from positive values (yellow) to negative ones (blue). In both cases of the coordinates a* and b*, 0 is a neutral value.
As far as instrumentation is concerned, all current colorimeters are, in principle, emission and reflectance spectrometers, and colorimetric values are calculated by their operating software. It is therefore easy to virtually set suitable measurement conditions using correction functions. Furthermore, the construction and design of such a device is significantly simplified. In contrast to such a device, the FM-104M photoelectric colorimeter with a 6500 K light source with a KTs-2 color comparator and a microcomputer operating on the principle of light spectrum reflection, developed in Russia in the 1960s, seems to be only a historical attraction. The disadvantages of the Russian device and method were the complexity of color measurement and instrumentation, and the need to adapt colorimeter photodetectors to certain sensitivity curves, as well as the long time it took to process the results, due to the lack of a suitable software algorithm (Gruzdeva, 1975; Zherebcov et al., 1977). Over the next decades, the Laboratory of the V.I. Lenin Mausoleum developed other contactless methods and built new spaces and facilities for measurement (Fig. 1).
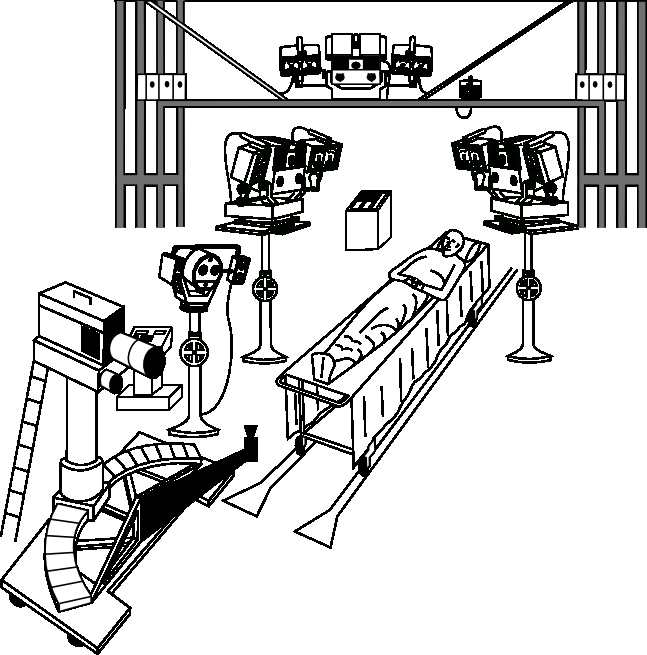 Figure 1. Equipment for contactless objective monitoring of bodies which have been embalmed for long periods of time at the All-Russian Research Institute of Medicinal and Aromatic Plants in Moscow. In the upper part there is a console with a stereo camera for measuring the relief and volume of soft tissues. Below the console are two identical devices and a control panel. At the bottom left are instruments for measuring the color of the skin. Graphics by Jiří Tauš |
Performing periodic colorimetric measurements on bodies which have been fixed for long periods of time is important for monitoring changes caused, for example, by oxidative processes taking place in the skin, which are accompanied by the formation of secondary compounds. Such changes could be caused by UV radiation. The changes in the alkaline hydrolysates of collagen, together with the formation of a chromophore, cause changes in the color of the skin from a light yellow to dark yellow, eventually progressing to a hue where yellow is only a slightly noticeable shade. A non-enzymatic glycosylation may also take place; this process is accompanied by the formation of fluorophores and chromophores. The described processes cause changes in the spectrophotometric and fluorometric characteristics of the skin (Vasilevskij, 2004; Vasilevskij et al., 2009).
Stereophotography has been evolving since the 19th century. This method has been used for the purpose of recording the changes in preserved bodies since the 1970s. To obtain stereophotographs, images of the same subject are taken from two different points which are spaced horizontally at a distance from the stereo base. In the 1980s and 1990s, specialized stereocameras with two or more lenses were used. The cameras captured the same object from different angles using a box with collimation marks and a plotting device. The head had to be placed in the Frankfort horizontal plane in relation to the plane connecting the optical axes of the lenses. The face graph was created in life size, with the most frequent outline interval of 2 mm. Contour maps of the face could be created by a microcomputer accompanied by a digitizer and a printer. Linear parameters connecting identifiable landmarks were calculated. Horizontal, vertical, or oblique outlines of the skin surface profile were created, and a 1 cm grid oriented on the centerline was drawn on the face based on the center points plotted on the graph. The intersections of the contour grid lines were recorded using a digitizer stylus that indicated the x and y coordinates. The Z coordinates were entered into the computer manually. Any changes were notable after comparison of coordinates and contour lines (Burke & Beard, 1967; Beard & Tee, 1980; Burke et al., 1983; Burke & Hughes-Lawson, 1988).
Photogrammetry uses a series of overlapping images taken by a camera or videocamera. The subject is captured in images taken from various places. Capture is performed at points with a known position, which makes it is possible to calculate the spatial position of the captured object. The coordinates of the point on the image and the horizontal parallax are measured. Pictures of the subject are taken with a 360° digital camera or a handheld 3D scanner. Sets of captured digital images are processed by generating points and 3D meshes. The final 3D models are created from points and polygons, then quantitatively algorithmically processed on the basis of the closest distances between the points, i.e., meshing (Urbanová, 2015b).
3D scanning of the face, hands, or other area of interest is performed using 3D scanners with a suitable resolution. A good example is the Vectra H1 (Canfield Scientific, USA) handheld optical scanner with volume difference software tool and capacity to visualize the degree of tissue volume changes using color distance. Mirror Photo Tool software (Canfield scientific GmbH, Germany) can be used to import high quality data. Another suitable scanner is the StereoSCAN 3D and CAD software (Matveichuk & Rozanov, 2015; Litvinov, 2016; Matveichuk et al., 2016). Before using the data, it is necessary to process them, i.e., to perform thresholding and plotting. For example, GOM Inspect software (GOM GmbH, Germany) or RapidForm 2006® (INUS Technology Inc., South Korea) (Koudelová et al., 2019) can be used to remove surrounding features which are outside the area of interest, and to detect changes in tissue volume by differences in peak coordinates.
By application of a whole-body protocol during post-mortem multidetector computed tomography (PM MDCT) examination, it is possible to determine an objective state of the soft tissues and skeletal structures. Subsequent three-dimensional data reconstruction involves image processing by thresholding and rendering a 3D object in any plane using software such as Amira (Thermo Fisher Scientific, USA), Meshlab (Institute of Information Science and Technologies, Italy) or GOM Inspect (Urbanová, 2015a). Results of the 3D reconstruction serve for further visualization and interpretation of the state of the preserved body (Panzer et al., 2013).
 Figure 2. Whole-body post-mortem CT examination performed as a part of the most recent re-embalming of Professor N.I. Pirogov in 2018 |
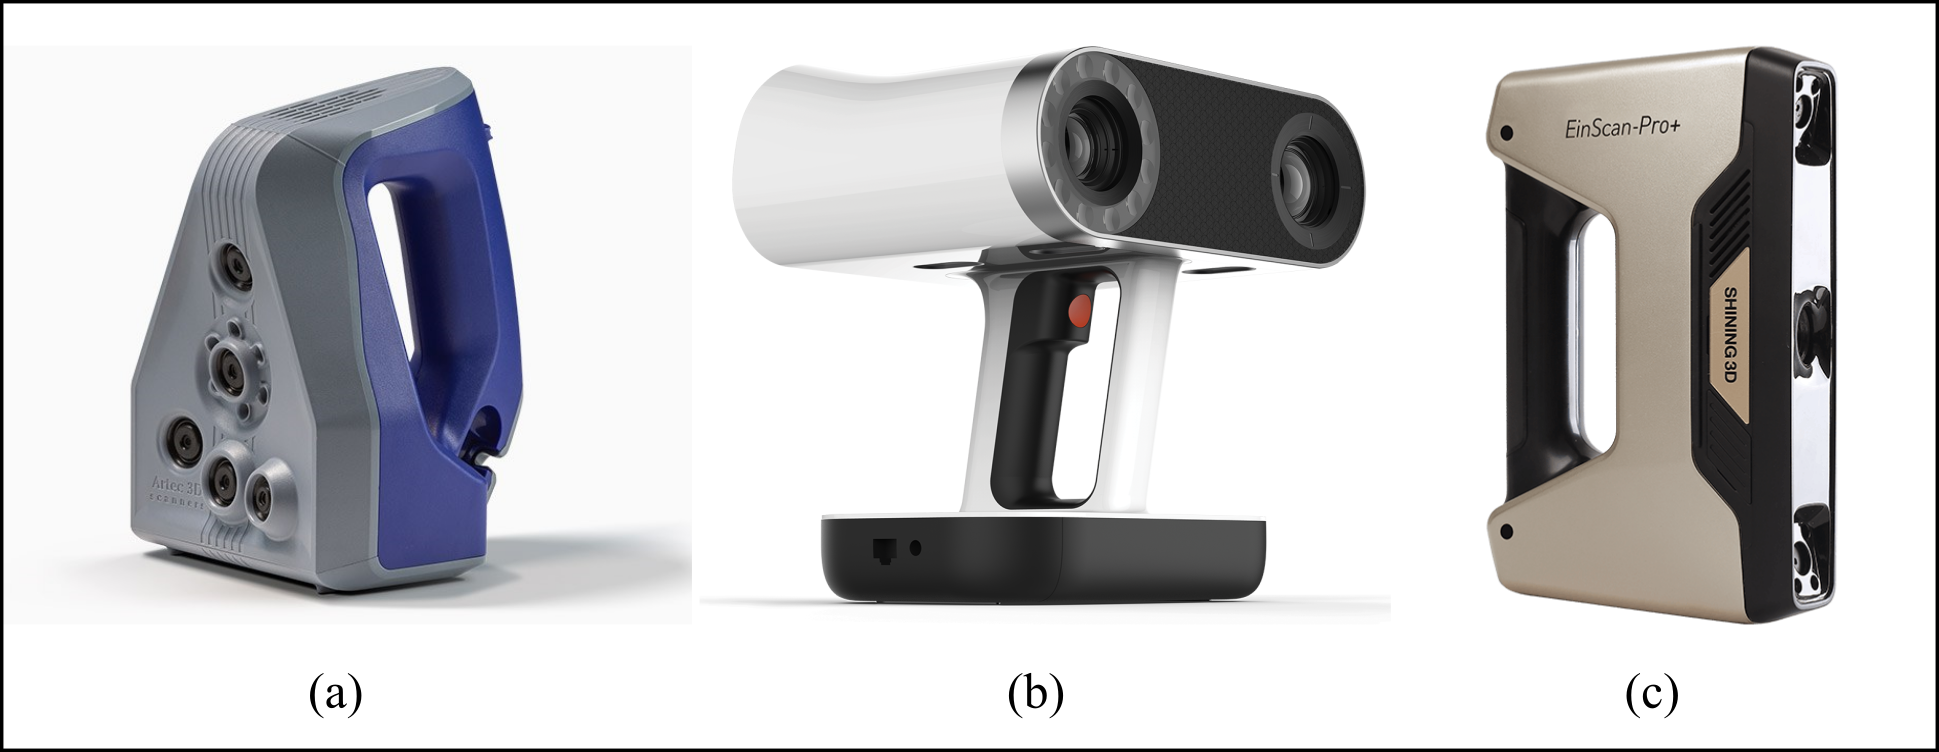 Figure 3. 3D scanners (a) Artec Space Spider; (b) Artec Leo; (c) Shining EinScan Pro+. Images taken from https://www.artec3d.com/ and https://www.shining3d.com/ |
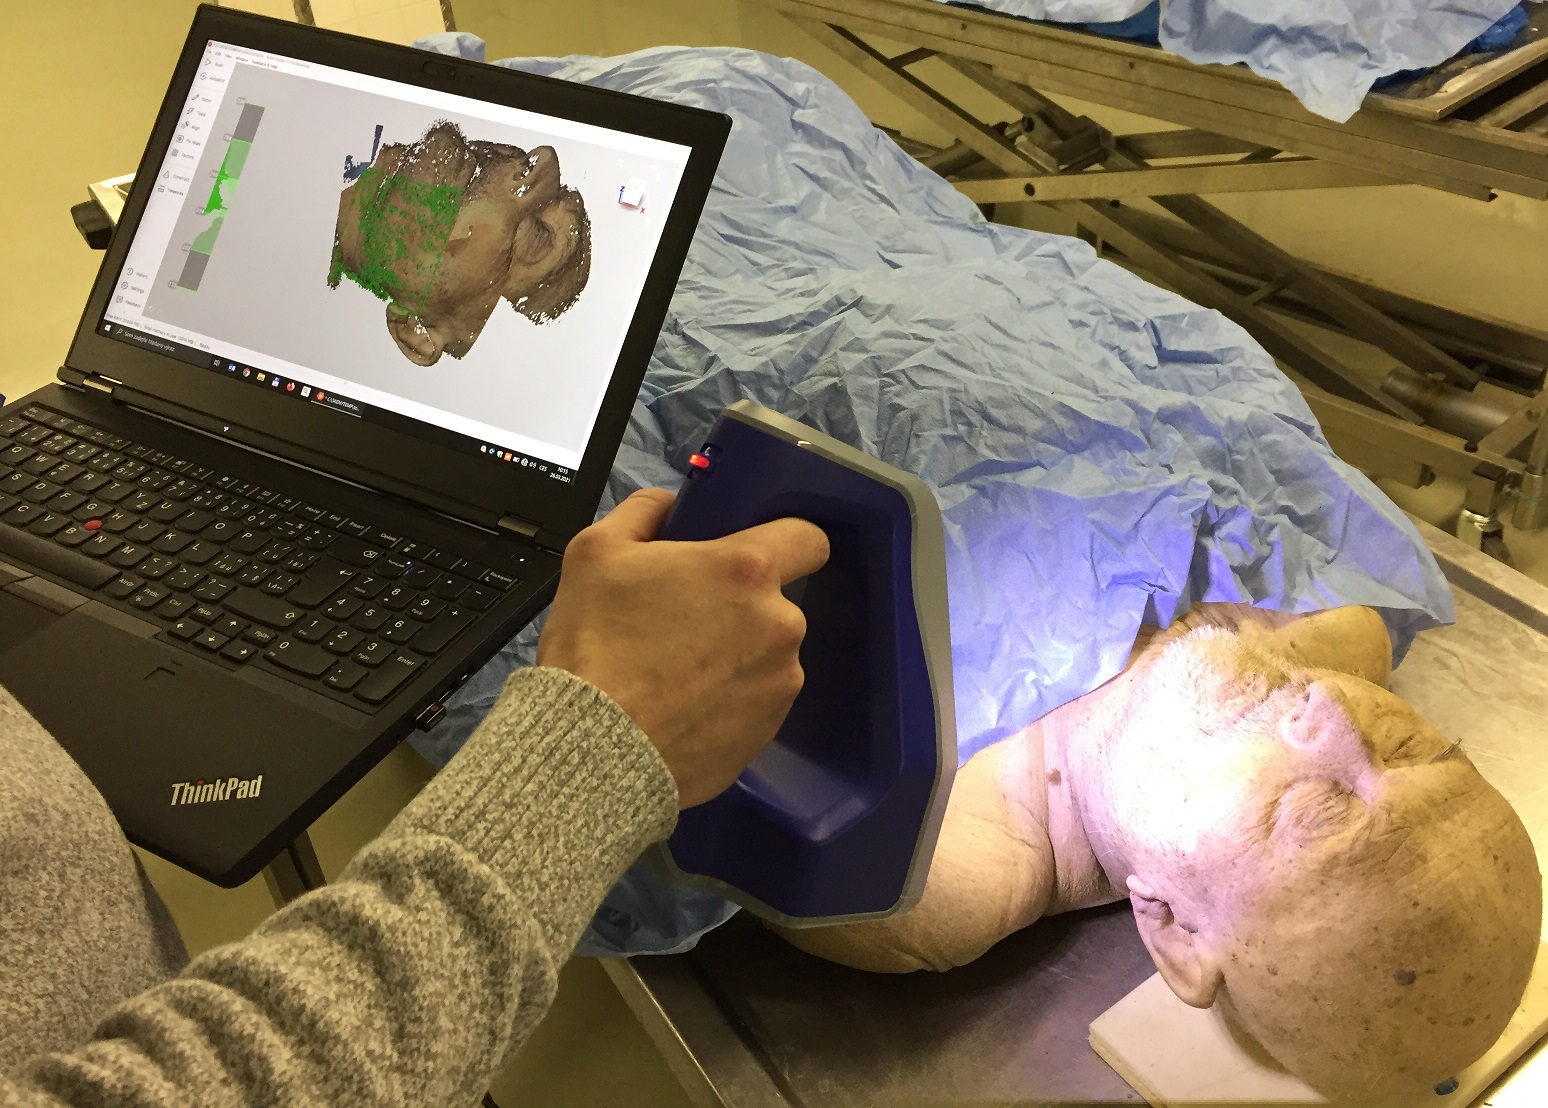 Figure 4. 3D scanning of the areas of interest on the head and hands of embalmed bodies |
Preserved bodies of the Department of Anatomy of the Faculty of Medicine of Masaryk University, Brno, Czech Republic, were used to verify the suitability of devices for monitoring methods. A PMCT (post-mortem computed tomography) examination with a whole-body protocol was performed as part of the re-embalming of Professor N.I. Pirogov in 2018 (Fig. 2).
A total of five male and female embalmed bodies (denoted as “bodies 1-5”) were used. The age at death was between 68 - 81 years. The post-mortem interval was between 1.5 to 6 years. All bodies from the Department of Anatomy were preserved by primary arterial perfusion with a solution containing 1 L formaldehyde, 6 L ethanol, 0.5 L glycerine, 1 L phenol, and 5 L distilled water. The volume of perfusion solution per body averaged 12 L. The second step of preservation included immersion in a solution of 70% ethanol for 8 weeks. The bodies were then stored in a refrigerator at 2° - 4° C for 1 - 2 years, followed by an immersion in a phenol solution, and periodic moisturising with a 0.5% solution of acetic acid.
Three different handheld scanners: Space Spider and Leo (Artec 3D, Luxembourg,) and EinScan Pro+ (Shining 3D, Hangzhou, China), were used for 3D scanning to compare their parameters. The parameters of the scanners used are given in Table 1, and their appearance can be seen in Figure 3 (www.artec3d.com; https://www.shining3d.com).
All five embalmed bodies were scanned with Space Spider and Leo scanners. The EinScan Pro + scanner was used only to compare volume changes in Body 4. The 3D scanning process was performed under standard conditions specified by the manufacturer of the equipment, while the distance from the scanned bodies was kept in the required range during the scanning (Fig. 4).
Table 1.
| Space Spider | Leo | EinScan Pro+ | |
| 3D point accuracy | 0.05 mm | 0.1 mm | 0.3 mm |
| 3D resolution | 0.1 mm | 0.2 mm | 0.7 mm |
| Scan speed | 1 mil points/s | 35 mil points/s | 0.45 mil points/s |
| Field of view, HxW | 180 x 140 mm | 838 x 488 mm | 300 x 170 mm |
| Data processing | Geometry and texture based | Geometry and texture based | Feature Align |
| Texture scan | Yes | Yes | No (possible with additional camera module) |
| Price | €19 700 | €26 700 | €5 000 |
The Leo scanner enabled scanning without any connection to a PC; all scanned data were stored in its internal memory, and only after the scanning was completed were the data transferred via an ethernet cable to the PC, where subsequent processing took place. Processing of the data was practically the same for both Leo and Space Spider scanners, and was done in Artec Studio 15 Professional software.
Scanning and data processing from the EinScan Pro+ scanner took place in the EinScan Pro software. The data processing procedure was very similar to the previous scanners. However, the data were scanned in one set, so it was not necessary to combine the scan sets using the three auxiliary points. Again, the processing involved deleting any surrounding irrelevant background data, polygonization, and export to an STL format.
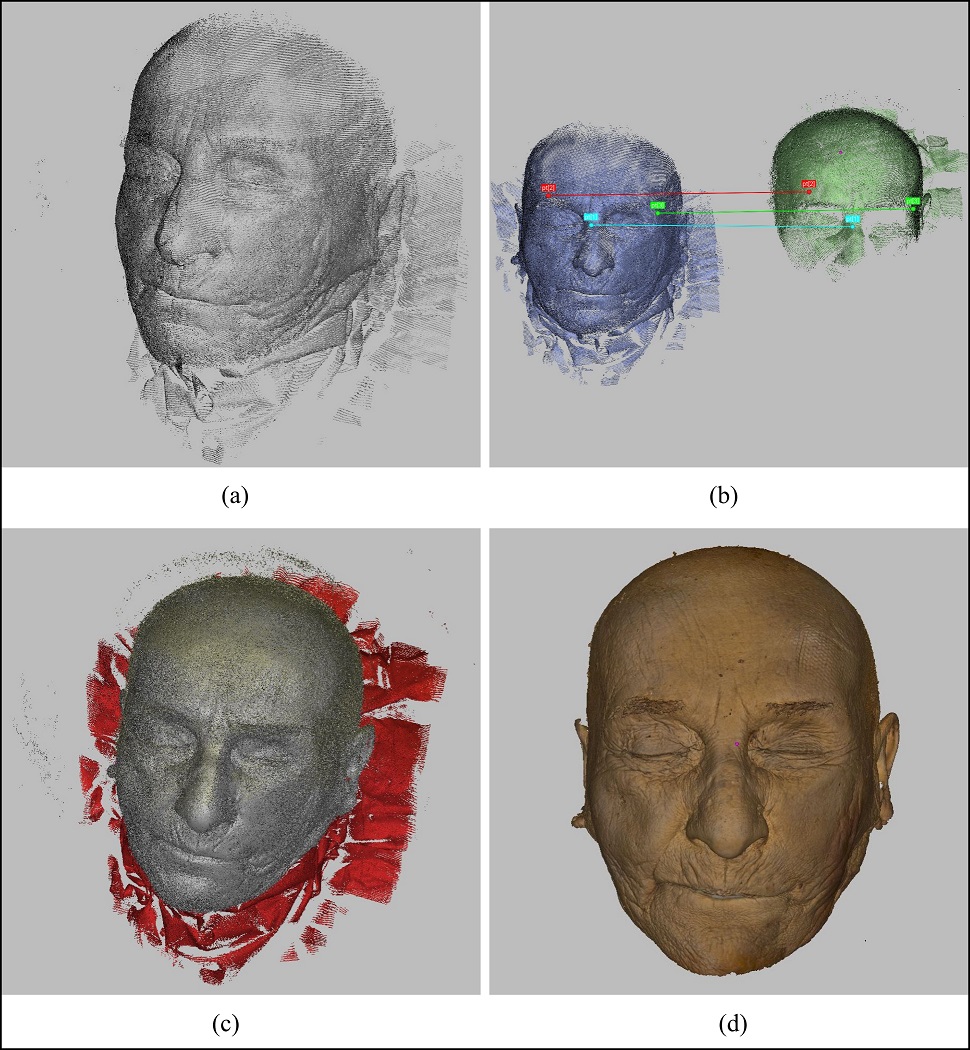 Figure 5. Processing of scanned data from the Space Spider scanner, data from Body 4: (a) result of scanning from a single scan set; (b) registration of two scan sets using three auxiliary points; (c) selection and deletion of redundant areas; (d) final scan in the form of a polygonal mesh with activated recorded texture |
 Figure 6. Determination of the correct position of the head of Body 5: (a) significant points used to position the face; (b) a side view of the positioned face |
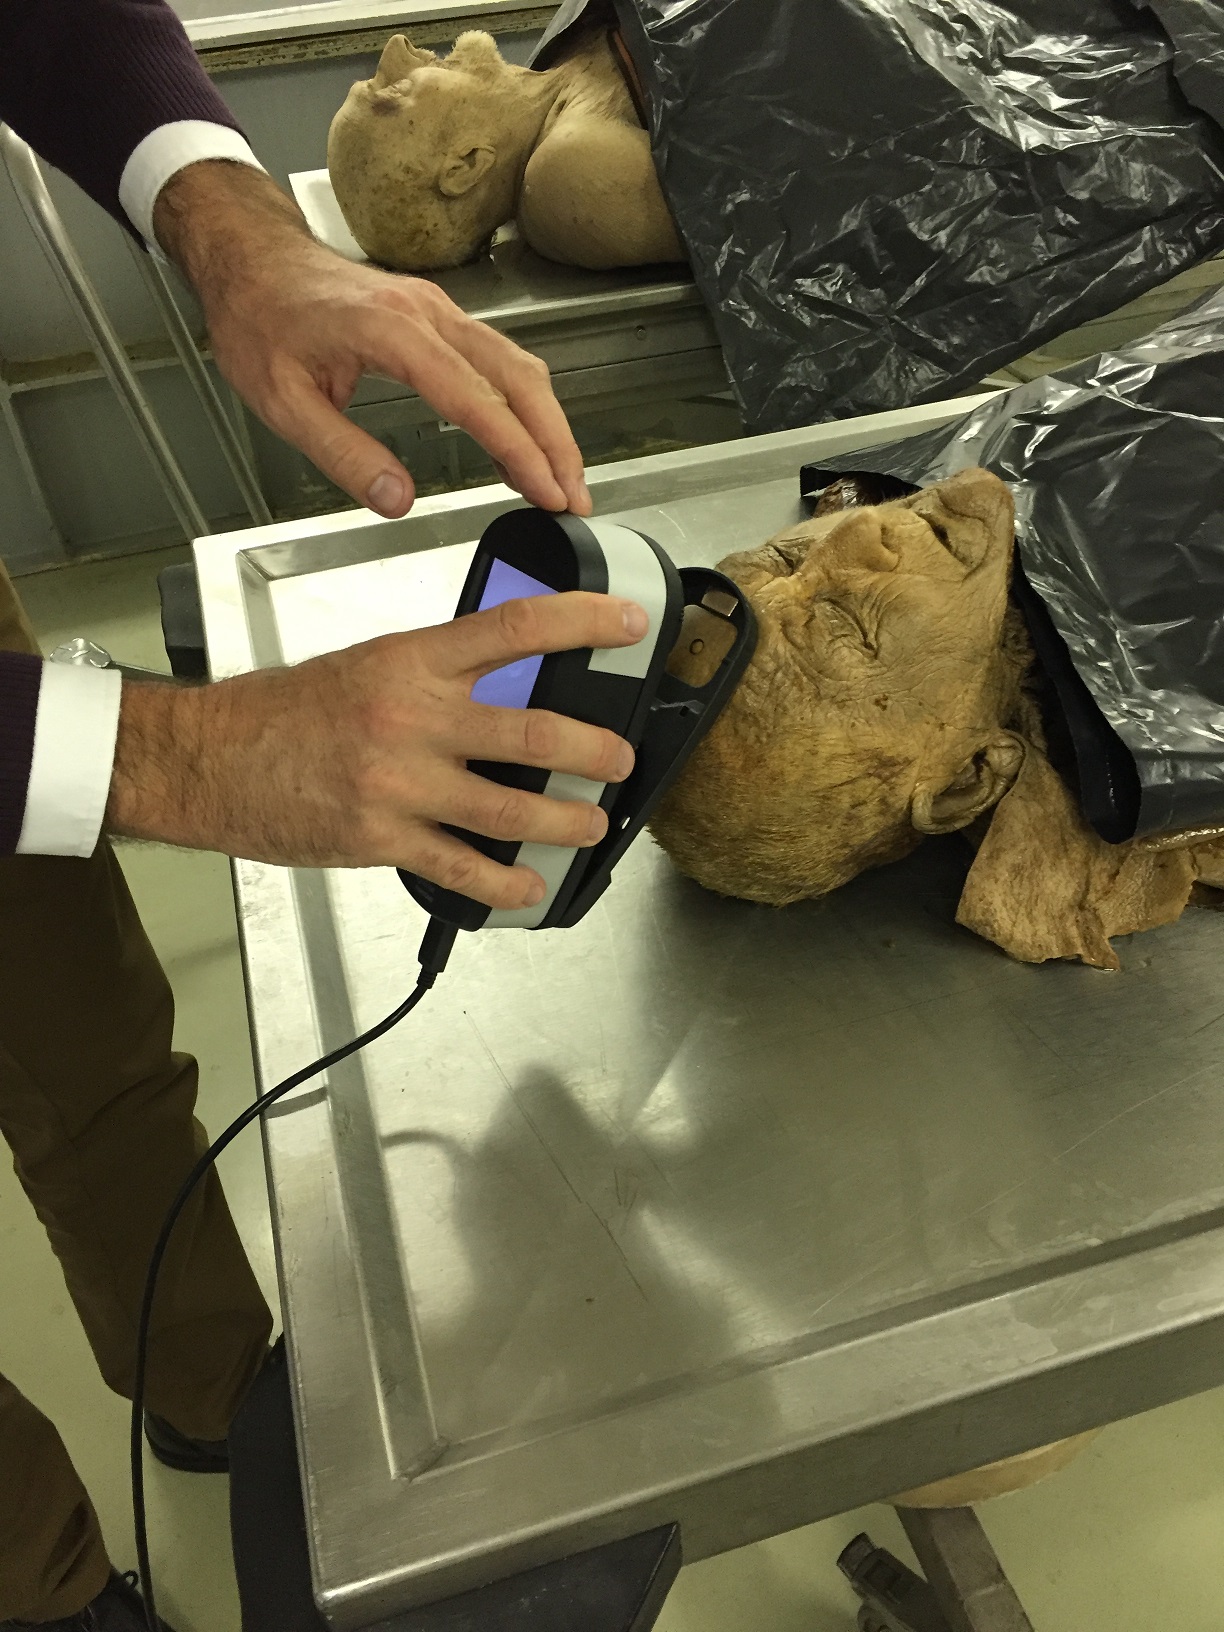 Figure 7. Taking colorimetric measurements of areas of interest on the head using the eXact Advanced colorimeter |
Data processing from the Space Spider scanner was performed in Artec Studio 15 Professional software (Artec 3D, Luxembourg, Luxembourg) (Fig.5 a-d). Scanning of the heads and hands of the embalmed bodies typically took place in two sets in order to sufficiently record all areas of interest. During data processing, these sets were subsequently registered by defining three points in approximately the same positions in each of the two sets. Since the areas with the three points could be overlapped, the software automatically aligned the two sets with high accuracy. Subsequently, irrelevant background data was manually selected and deleted. The last step was to merge all the scanned data into one polygonal mesh (so-called fusion) and activate the captured texture of the scanned body. For further processing, the polygonal data was exported to the STL format.
When creating surface maps, it was difficult to establish the position of the face, because different inclinations would lead to different results. A system of specific orientation points on the face was used for this purpose (Paternoster et al., 2012). Setup in the GOM Inspect software was performed using method 3-2-1 applying the Frontal and Transverse planes and MC points (chin point). The selected orientation points on the face were used to create planes and points (Paternoster et al., 2012; Savoldelli et al., 2019) (Fig. 6a), as well as to position the face when viewed from the side (Fig. 6b). The procedure for creating face adjustment elements is as follows: Frontal Plane - fitted plane through RMC (right medial canthus), LMC (left medial canthus), RCH (right cheilion) and LCH (left cheilion) points; Transverse Plane - plane perpendicular to the frontal plane and passing through RMC and LMC points and MC point; Mid-endocanthion Point lying halfway between RMC and LMC points (Paternoster et al., 2012).
The surface map was also created based on the same data from the EinScan Pro+ scanner as in the case of the volume differences. After aligning the face according to the procedure described above, the FN (Frontal - Nose) Plane was created, which is parallel to the Frontal Plane and offset to the tip of the nose. From this plane, a set of 45 sections was subsequently created, 2 mm apart. Every 5th cut (10 mm) was then highlighted by a bolder line.
An EinScan Pro+ scanner was used to scan the data to compare the volume difference of the soft tissues. Scanning was performed before and after the experimental change of the volume on the face of Body 5. Obtained data were aligned together in the GOM Inspect software using the best-fit function (Gauss, 3-sigma). Surface comparison evaluation was created.
Colorimetric measurements were performed with an eXact Advanced spectral colorimeter (X-Rite International, Inc., Barbados) at 9 to 12 predetermined sites of interest (Fig. 7). It is ideal to perform at least 10 consecutive measurements on the head, at the forehead, both temples, in the nasion, crus helicis on both sides, right and left cheeks, philtrum, right and left mandible, and at the tip of the chin. In the case of a contact colorimeter, 9 available places for measurement taking must be selected. These places need to be accessible and allow for the contact of the measuring apparatus of the device used.
Diagnostic examination of the body of N.I. Pirogov was performed on a Siemens SOMATOM go.Up CT machine (Siemens Healthineers AG, Germany). Parameter settings were as follows; voltage 110-130 kV, 30-230 mAs / ref, in spiral scanning mode 32 x 0.7 mm, pitch 0.8, reconstruction thickness 0.8 - 3 mm. The Br40, Hr40, and Hr60 cores were used.
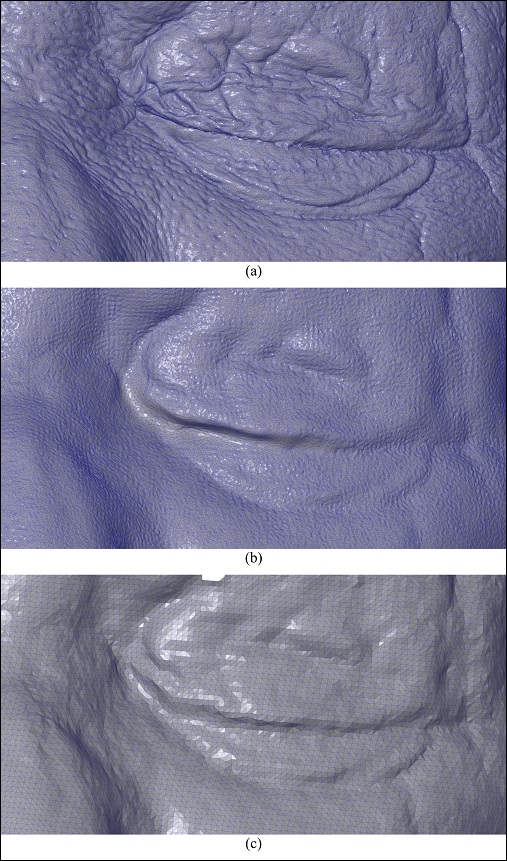 Figure 8. Resolution comparison of individual scanners on the orbital area of Body 5: (a) Space Spider; (b) Leo; (c) EinScan Pro+ |
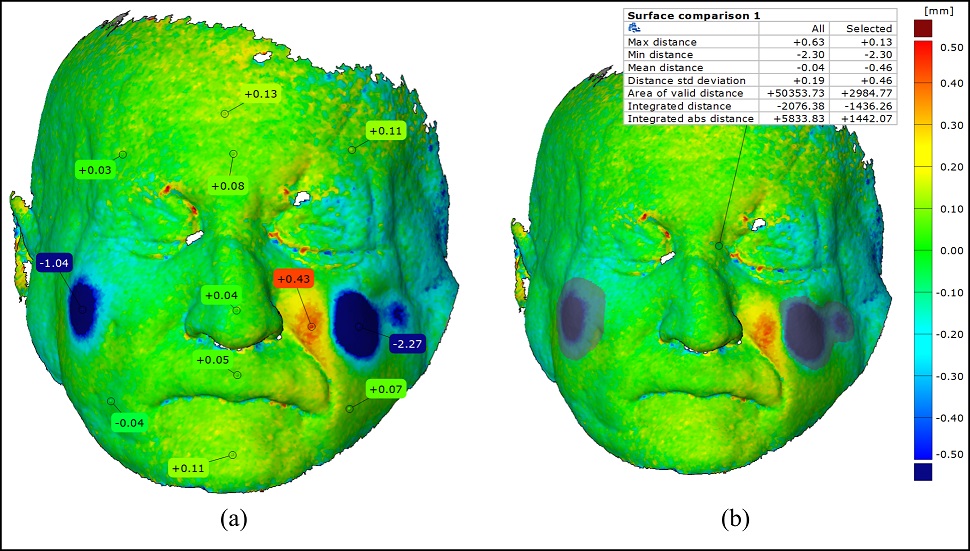 Figure 9. Surface comparison of scanned data before and after soft tissue volume change: (a) surface distances at specific points; (b) surface comparison characteristics |
By comparing the resolution results of individual 3D scanners, obvious differences were found in their ability to capture detail. By far the best results were from the Space Spider scanner: the resulting point cloud was very dense, and the scanner was able to capture details even in the form of individual wrinkles and pores on the skin (Fig. 8a). The Leo 3D scanner had a comparable network density, and the file size was almost the same, but there was a lower ability to capture detail. Despite the obvious smoothing, the surface showed a particular structure with small bumps (Fig. 8b). The resulting point cloud obtained with the EinScan Pro+ 3D scanner had the lowest density. Also, the file size was approximately 10 times smaller than in the previous two types of scanner (Fig. 8c). However, compared to the Leo scanner, the captured detail looked very similar.
Data processing, even if it took place in different software (Artec Studio and EinScan Pro), was comparable in complexity for both types of software. The procedures were very similar. Artec Studio was more user-friendly and offered more options for editing of scanned data based on quality parameters. A simplification of the scanning process would be if the object can be scanned in one set, and thus the sets do not have to be interconnected by means of three auxiliary points and mutual overlap of the scanned sets.
Changes in soft tissue volume are evident after a surface comparison. Specific highlighted points and deviations between the surfaces at these points are clear (Fig. 9a). The evaluation of volume changes in specific marked areas is evident (Fig. 9b). Surface comparison characteristics include, for example, maximum and minimum deviations over the entire surface of the monitored body, as well as in selected areas. Among other things, we can derive a volume change for the compared surfaces, which is expressed as Integrated Distance and is expressed in mm3.
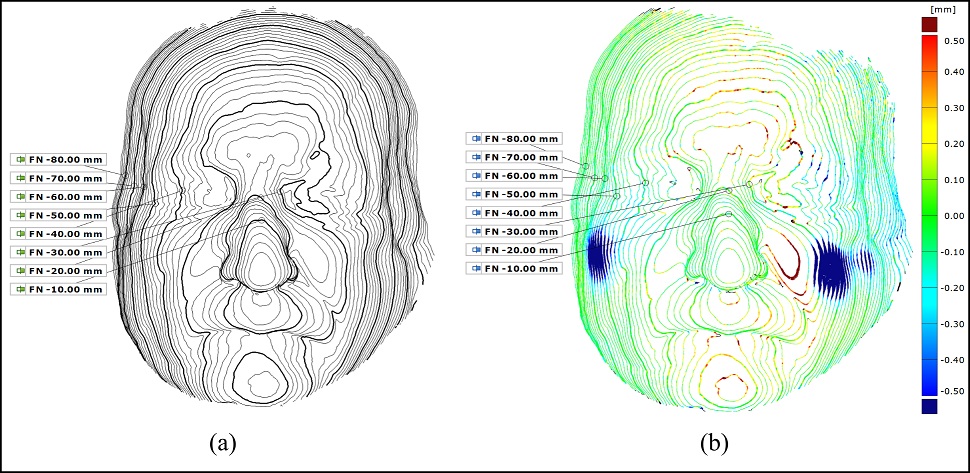 Figure 10. Surface changes maps of the face of Body 5: (a) before the change in volume; (b) deviations on the surface changes maps showing the state after the experimental change in the volume of soft tissues |
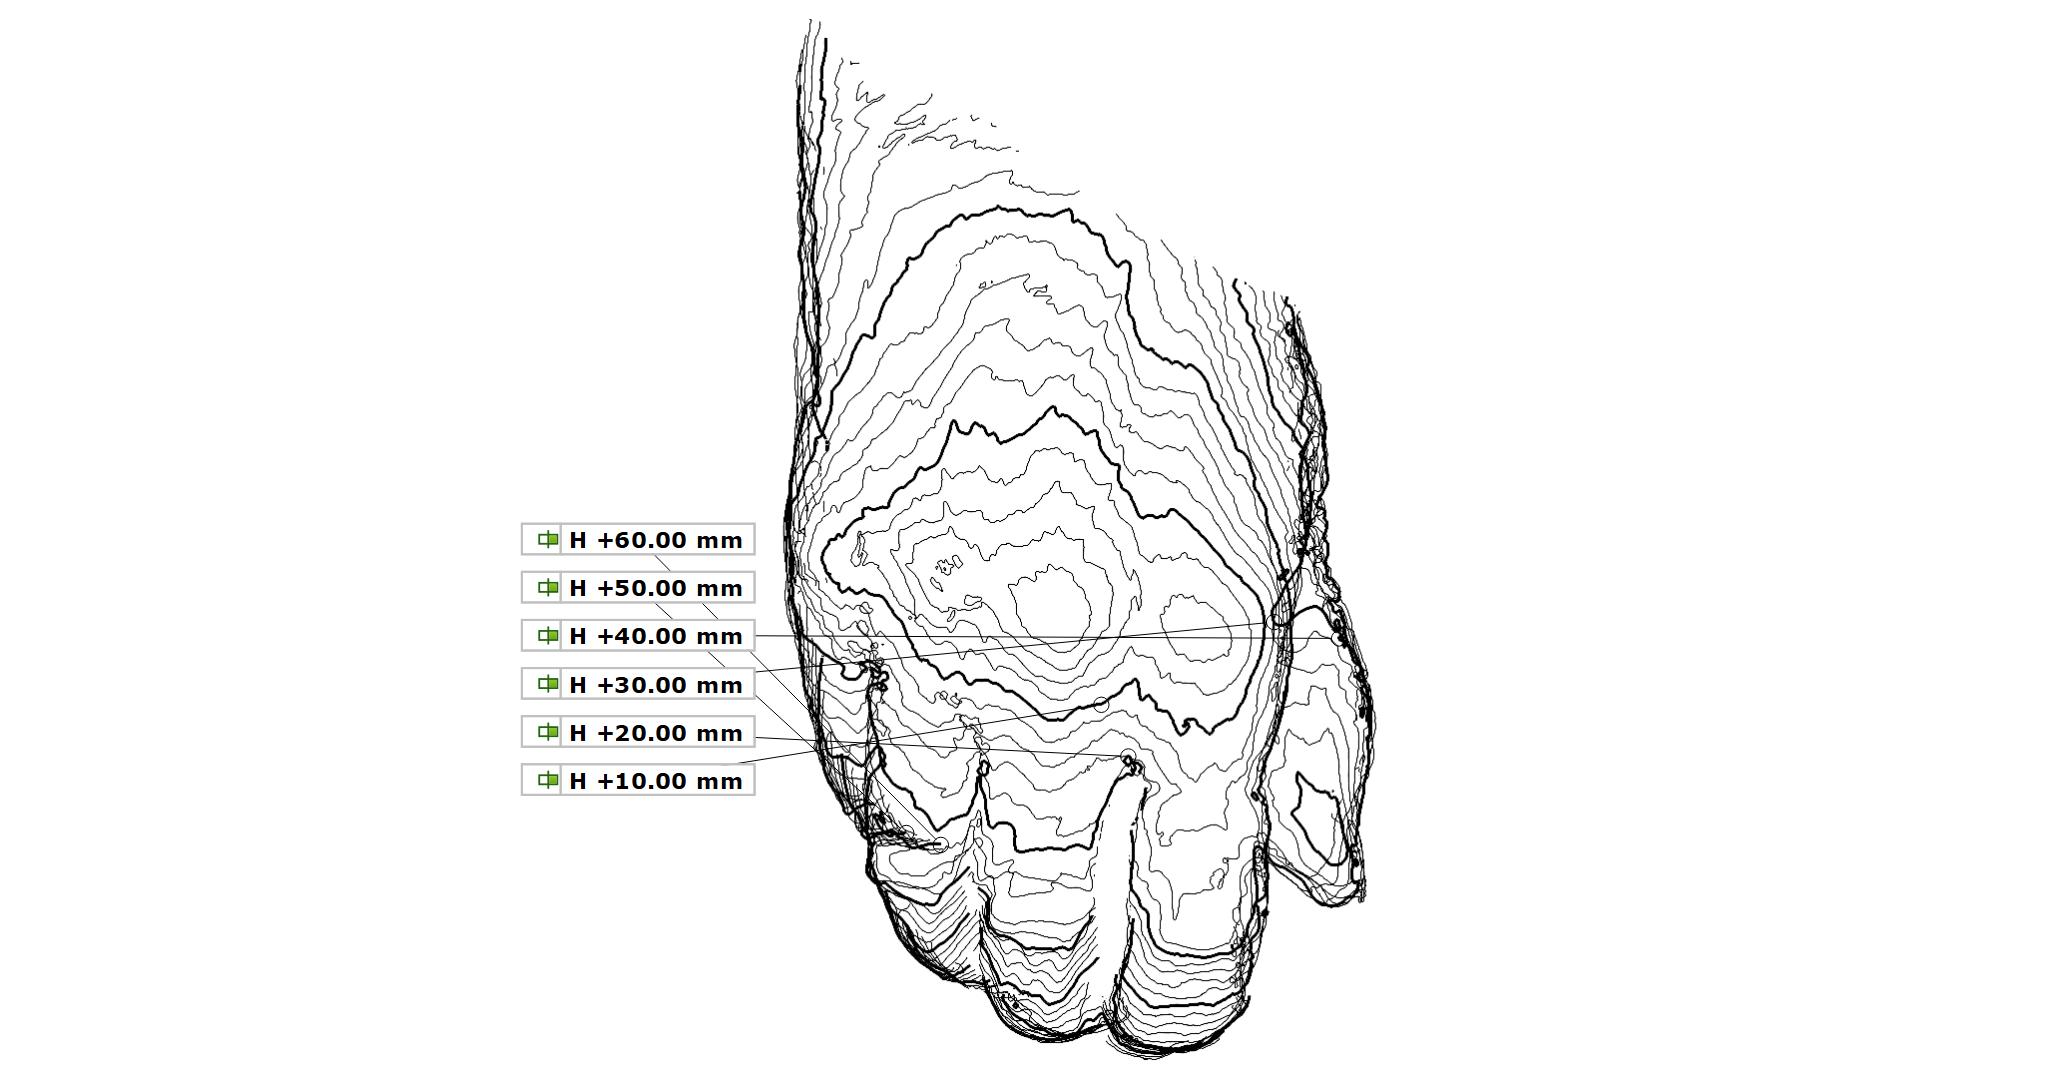 Figure 11. Surface changes maps with elevation dimensions on Body 1 |
A surface map of the face of Body 5 was made (Fig. 10a). Deviations after the experimental change of soft tissue volume are shown on the second surface map (Fig. 10b). However, from the principle of creating relief maps, these are only deviations in the X plane (screen plane). A relief map of the hand of Body 1 was also created (Fig. 11).
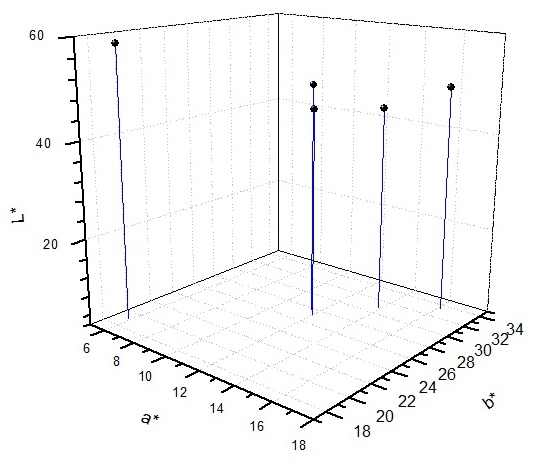 Figure 12. Average color coordinates of the selected point of interest on the foreheads of all five bodies included in the study |
The obtained colorimetric data only allowed assessment of the color of individual skin samples on bodies included in the study, and the relative differences between them. It would be interesting to monitor the development of color during the preservation of bodies; this, however, requires long-term monitoring, and was not the object of this study. Figure 12 summarizes the average color coordinates of the selected point of interest on the heads of all five bodies included in the study.
A CT scan of the skeleton of N.I. Pirogov showed a reduced density of skeletal structures, which may indicate osteochondritis and osteoporosis. These changes were clearly visible partly on the skull (Fig. 13), the whole cervical spine C1-C 7, and Th 1, 2 and 4, right ribs 1 - 6, left rib, right scapula, proximal third of the left humerus, and proximal and middle thirds of the right humerus. Repaired bone defects were found in the limbs, which were a result of sampling during previous re-embalming procedures. Additional defects were found on the phalanges (Fig. 14). Examination of the soft tissues of the cranial cavity showed a significantly reduced volume of brain tissue, mainly in the occipital area (in both lobes), and loss of the brainstem, cerebellum, and spinal cord tissue. Furthermore, gauze tamponades of the oral and nasal cavities was found, located in part of the right maxillary sinus, part of the oropharynx, the larynx, and the trachea at the level of T 1 and T 2, and the front of the neck at the level of the hyoid bone. Mediastinal organs were selectively centrally collapsed to ½ size. Gas was present in the heart cavity, the lumen of the blood vessels, and the bronchial tree. Tissue of heterogenous structure was found in the right hypochondrium; this was probably the remains of the liver. The sigmoid colon, rectum and prostate were found in the true pelvis.
 Figure 13. CT scan of the skull of N.I. Pirogov en face with changes in the region of the maxilla |
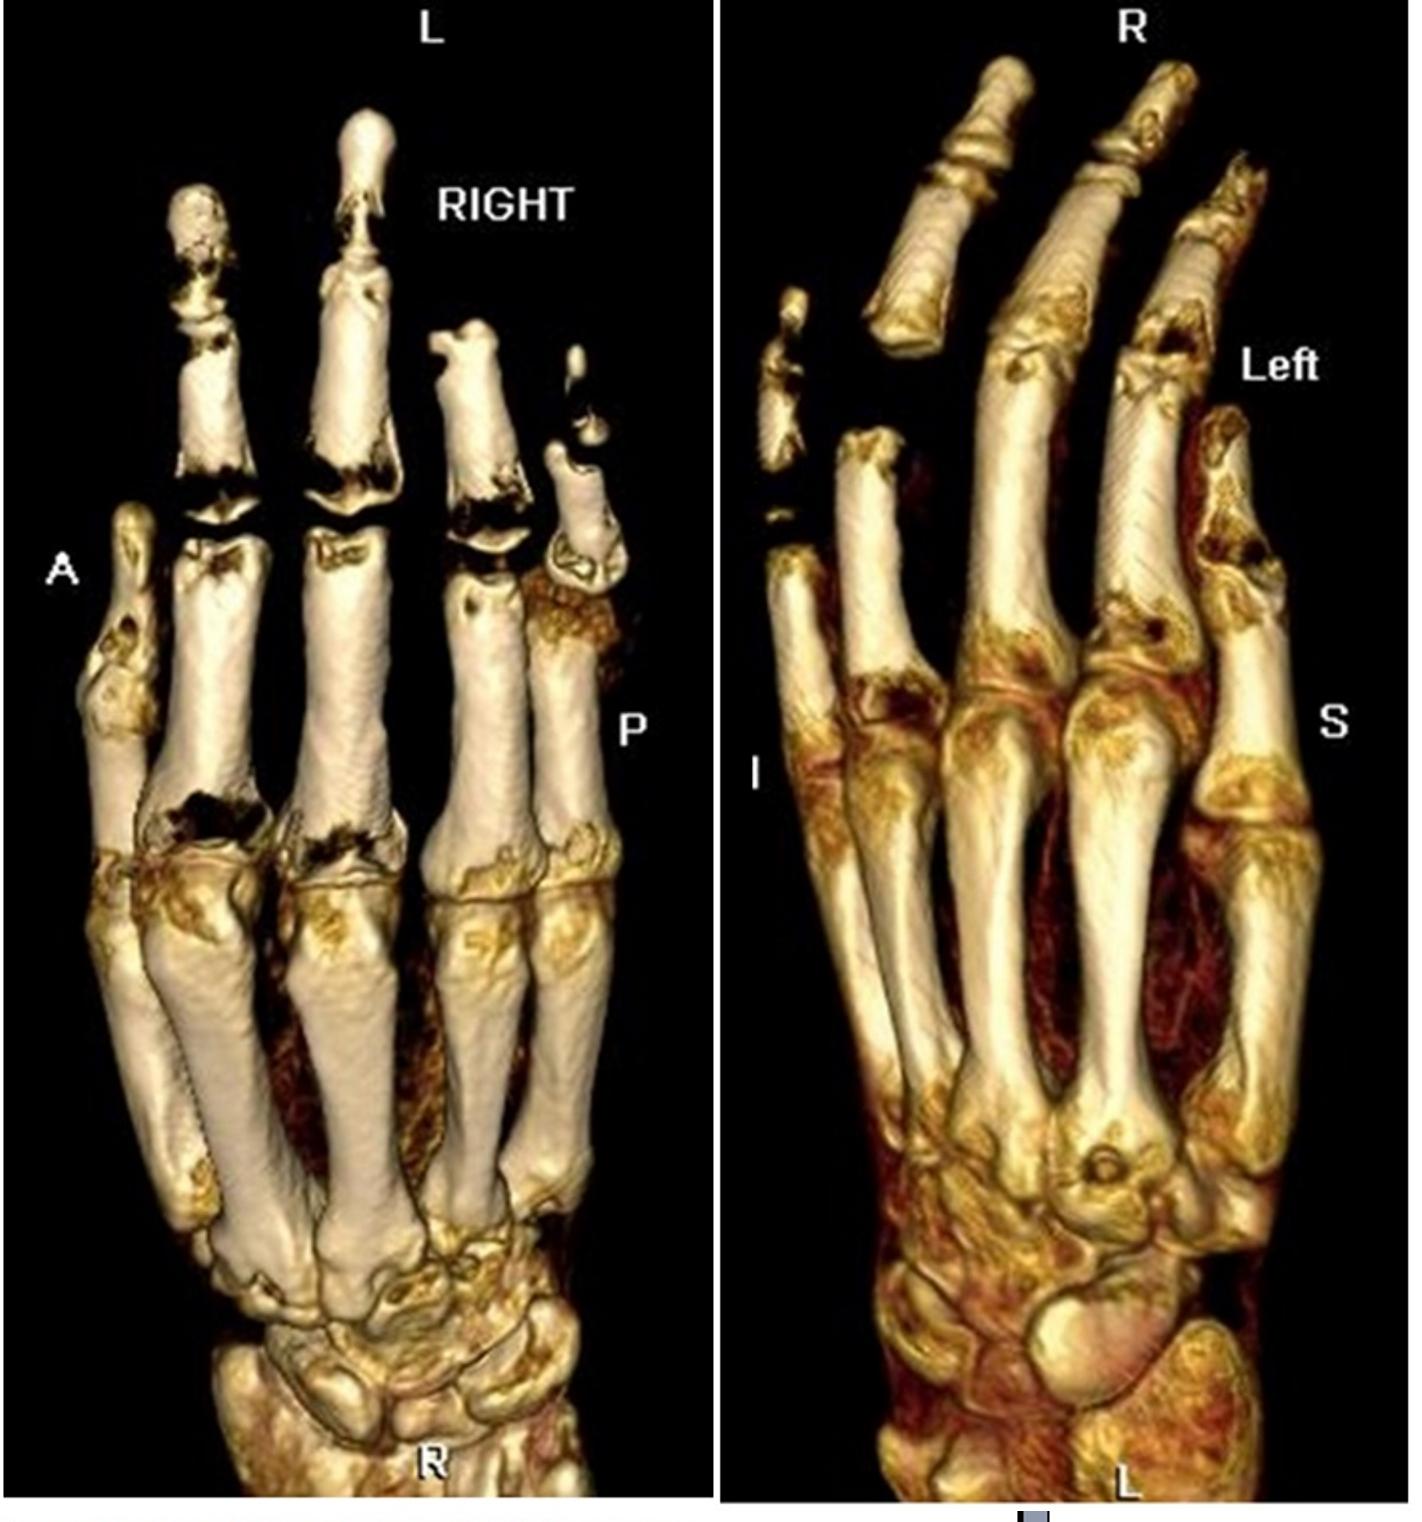 Figure 14. CT image of the bones in the right and left hand of N.I. Pirogov with destructive changes to the phalanges |
Based on the results reported here it would be suitable to perform colorimetric measurements at points of interest (forehead, temples, earlobes, cheeks, lower jaw, and chin) during, and for some time after, a planned body embalming, and then compare the results. Colorimetry can also be used to compare skin color changes when using different methods of body preservation or embalming. Changes in skin color indicate ongoing degradation processes, and colorimetry allows for such processes to be detected early before they become visually apparent. The results show that any readily-available compact hand-held device, of which there are a large number on the market, can be used to register the color of the skin.
The complexity of 3D scanning is comparable for both the Space Spider and EinScan Pro+ scanners. However, with the second scanner it was sometimes more problematic to overlap the scan sets with each other, and during scanning it was necessary to move the scanner very smoothly. Scanning with the Leo scanner was easier, thanks to the absence of a physical connection to a PC, and the ability to monitor the scanning process directly on the scanner display. The Leo scanner could be further away from the scanned object, which can be an advantage, but also a disadvantage, for example in a limited space. Profilometry can also be used for surface registration (Astahov, 2000).
For long-term preservation of bodies, it is also necessary to create constant storage conditions, i.e., by preventing microbial contamination of the body, ensuring a constant temperature and relative humidity, maintaining a protective atmosphere in the sarcophagus/coffin, and preventing UV radiation.
For accurate results of measurements of soft tissue changes over time, it is necessary to record detailed documentation of the condition of the areas of interest, such as the head and hands, before and after the embalming takes place. It is also imperative to follow precise embalming and preservation procedures, and perform regular checks and upkeep of the body. Furthermore, it is important to handle the body with care, especially regarding any areas of interest which are located according to precise coordinates. With all these factors, it is possible to create constant conditions for accurate and objective monitoring of the changes taking place on and in the body. The disadvantage of monitoring the state of the body in cases of long-term preservation is the high purchase price of the necessary measuring instruments. Therefore, it is preferable, if possible, to borrow the instruments, or to order a scanning and data processing service with subsequent evaluation of any changes by an expert. A great benefit for non-contact body monitoring is the use of CT examination, which allows the visualization of internal organs and the condition of other tissues, at the macroscopic level. The greatest advantages include both the speed of the examination and the evaluation of the result.
Astahov Ju.Ju. 2000: K voprosu o primenenii metoda profilometrii dlja kolichestvennoj otsenki rel'yefa kozhi cheloveka. Biomedicinskie tehnologii: Sb. nauch. Rabot. Trudy mezhvedomstvennogo nauchno-issledovatel'skogo i uchebno-metodicheskogo centra biomedicinskih tehnologij. [On the issue of applying the profilometry method for quantitative assessment of the relief of the human skin. Biomedical technologies: scientific works. Proceedings of the interdepartmental research and educational - methodological center of biomedical technologies]. 9: 110-115 [In Russian].
Beard LFH, Tee JE. 1980: An approach to the introduction of stereophotogrammetry as an alternative to traditional methods of measurement. ISPRS Archives 23: 62-68.
Burke PH, Beard LF. 1967: Stereo-photogrammetry of the face. Rep Congr Eur Orthod Soc 1: 279-93.
Burke PH, Banks P, Beard LF, Tee JE, Hughes C. 1983: Stereophotographic measurement of change in facial soft tissue morphology following surgery. Brit J Oral Surg 21(4):237-45.
https://doi.org/10.1016/0007-117X(83)90012-4
Burke PH, Hughes-Lawson CA. 1988: The growth and development of the soft tissues of the human face. J Anat 158:115-120.
Frišhons J, Vacín L, Tauš J, Melnyk OP, Guminskii YJ, Tkach GF. 2020: Embalming techniques for long-term preservation of bodies. J Plast 32 (2): 9-21.
Gruzdeva L. 1975: Objektivnyi beskontaktnyj metod. Bjulleten' jeksperimental'noj biologii i mediciny. [Objective non-contact method. Bulletin of Experimental Biology and Medicine] 79 (4): 120-122 [In Russian].
https://doi.org/10.1007/BF00832732
Koudelová J, Hoffmannová E, Dupej J, Velemínská J. 2019: Simulation of facial growth based on longitudinal data: Age progression and age regression between 7 and 17 years of age using 3D surface data. PLoS One 14(2): e0212618.
https://doi.org/10.1371/journal.pone.0212618
Litvinov YY. 2016: Innovacionnye podhody k objektivnoj registracii sostojanija poverhnosti i objemov obrazcov rastenij i biologicheskih tkanej. Sbornik nauchnyh trudov mezhdunarodnoj konferencii "Biologicheskie osobennosti lekarstvennyh i aromaticheskih rastenij i ih rol' v medicine" [Innovative proposals for the objective registration of the surface and volume of plants and biological tissues. Collection of scientific papers of the international conference "Biologicheskie osobennosti lekarstvennyh i aromaticheskih rastenij i ih rol 'v medicine"] 6: 394-398 [In Russian].
Matveichuk IV, Rozanov VV. 2015: Ispolzovanie beskontaktnogo metoda objektivnoj registracii sostojanija poverhnostej biologicheskih objektov s primeneniem stereoscan 3D [Implementation of a contactless method of objective registration of the composition of biological objects with a 3D stereoscan]. Nauchno-tehnicheskaja konferencija "Mediko-tehnicheskie tehnologii na strazhe zdorovija". Sbornik dokladov 18-25 sentjabrja 2015, Krym [Scientific and technical conference on medical and technical technologies guarding health. Collected papers 18-25 September 2015, Crimea] [In Russian].
Matveichuk IV, Litvinov YY, Rozanov VV. 2016: Nauchno-metodicheskie osnovy objektivnoj registracii sostojanija poverhnostej biologicheskih objektov s ispol'zovaniem innovacionnyh metodov [Scientific and methodological foundations of objective registration of surface condition of biological objects using innovative methods]. Morfologija [Morphology] 149(3):134 [In Russian].
Panzer S, Gill-Frerking H, Rosendahl W, Zink AR, Piombino-Mascali D. 2013: Multidetector CT investigation of the mummy of Rosalia Lombardo (1918-1920) Ann Anat 195(5):401-8.
https://doi.org/10.1016/j.aanat.2013.03.009
Paternoster L, Zhurov AI, Toma AM, Kemp JP, St Pourcain B, Timpson NJ, McMahon G, McArdle W, Ring SM, Smith GD, Richmond S, Evans DM. 2012: Genome-wide association study of three-dimensional facial morphology identifies a variant in PAX3 associated with nasion position. Am J Hum Genet 90(3):478-485.
https://doi.org/10.1016/j.ajhg.2011.12.021
Savoldelli C, Benat G, Castillo L, Chamorey E, Lutz JC. 2019: Accuracy, repeatability, and reproducibility of a handheld three-dimensional facial imaging device: The Vectra H1. J Stomatol Oral Maxillofac Surg 120 (4):289-296.
https://doi.org/10.1016/j.jormas.2019.03.012
Urbanová P, Jurda M, Čuta M. 2015a: Záznam a analýza digitálních dat v antropologii [Recording and analysis of digital data in anthropology] Nakladatelství Masarykovy University, Brno, Czech Republic. [In Czech].
Urbanová P, Hejna P, Jurda M. 2015b: Testing photogrammetry-based techniques for three-dimensional surface documentation in forensic pathology. Forensic Sci Int 250 (1): 77-86.
https://doi.org/10.1016/j.forsciint.2015.03.005
Vasilevskij VK. 2004: Opyt kompleksnogo primenenija objektivnyh metodov ocenki reljefa i cveta kozhnogo pokrova cheloveka v kosmetologii. Biomedicinskie technologii i radioėlektronika: ezhemesjachnyj nauchno-prikladnoj zhurnal. [Experience in the complex application of objective methods for assessing the relief and color of human skin in cosmetology. Biomedical Technology and Radio Electronics: Monthly Scientific and Applied Journal] 1-2: 68-76 [In Russian].
Vasilevskij VK, Semkin VI, Golubev VP. 2009: Izuchenie vlijanija faktorov vneshnej sredy na cvet i strukturu fiksirovannoj kozhi cheloveka. Voprosy biologicheskoj, medicinskoj i farmacevticheskoj himii. [Study of the influence of environmental factors on the color and structure of fixed human skin. Biological, Medical and Pharmaceutical Chemistry Issues] 12 (2): 45-48 [In Russian].
Zherebcov LD, Vasilevskij VK, Bremzen SA. 1977: Objektivnye issledovanija cveta kozhnogo pokrova cheloveka. Vopr. antropologii. [Objective observation of the color of the leather cover cheloveka. Questions of Anthropology] 56:146-153 [In Russian].