1Department of Morphology, Federal University of Espirito Santo, Brazil
2Biochemistry Graduation Program, Federal University of Espirito Santo, Brazil
3Department of Physiological Sciences, Federal University of Espirito Santo, Brazil
4Department of Medical Education, College of Medicine and Life Sciences, University of Toledo, Ohio, USA
In order to find the best viscosity of silicone to use in plastination at different temperatures, based on shrinkage, three silicones of different viscosities [100, 470, 1330 mPa.s (cP) (P1, S10, P10)] at 20 °C were used, and shrinkage of impregnated specimens was measured. Twenty-four bovine kidneys fixed in 10% formalin for 30 days were used, organized into 2 groups: 12 kidneys were impregnated at room temperature (RT) (25 ± 2 °C) and 12 kidneys were impregnated at cold temperature (CT) (-15 ± 2 °C). The silicones used were: Poliplast 1 (P1) and Poliplast 10 (P10) (Polisil Silicones Ltda), which are used for RT and CT protocol in South America, and S10 (Biodur®). Impregnation speed was regulated by observing bubble production and bursting on the polymer surface (1 bubble/second/observed area). To quantify tissue shrinkage, kidney volumes were measured before and after forced impregnation. After impregnation, shrinkage of each kidney was calculated and compared. Statistical analysis of the results was performed (ANOVA and Duncan test). Comparing the shrinkage between the three silicones, P10 silicone had the greatest shrinkage (39% at RT, 45.4% at CT), silicone P1 had the least shrinkage (4.75% at RT, 15.5% at CT), while S10 silicone had 17.8% at RT and 30.9% at CT. P1 silicone had less tissue shrinkage when compared to S10 silicone for the CT and RT methods. In conclusion, P1 proved to be an alternative silicone for plastination, causing less tissue shrinkage in the subgroups tested.
Biodur®; impregnation; plastination; Polisil™; shrinkage; silicones; viscosity
Athelson S Bittencourt, Federal University of Espirito Santo, Health Sciences Center, Marechal Campos Avenue, 1468, Maruipe, Vitoria- ES, Brazil, Zip code: 29.043-900, Fax: +55 27 33357358, email: athelson@hotmail.com

![]()


Impregnation is the central step in the plastination process and is important for good specimen quality (von Hagens, 2019). This step was described by Gunther von Hagens in 1977, who unveiled the cold reactive impregnation-mixture: silicone (S10) and catalyst (S3) for forced impregnation. In 1998, Daniel Corcoran introduced a new concept and product line for impregnation at room temperature. His new concept changed the impregnation-mix to polymer with cross-linker, which is not reactive (Glover & Henry, 1998; Starchik & Henry, 2019). However, the cold plastination process was already being used at room temperature in some labs.
Silicones, siloxanes, or polysiloxanes are mixed polymers of organic and inorganic material of the general formula [R2SiO]n, where R is an organic group such as methyl, ethyl, or phenyl (Chaynes & Mingotaud, 2004). The obtained polymers are inert, odorless, and resistant to decomposition by heat, water, or oxidizing agents, besides being good electrical insulators (Miles & Briston, 1975). The silicones used in plastination are linear chains with methyl groups, called polydimethylsiloxanes (PDMS).
Synthesis of silicones generally occurs in two steps: production of chlorosilanes, then hydrolysis of chlorosilanes to cyclic siloxanes. The cyclics formed in the second step of the synthesis then undergo polymerization to create PDMS, a long or short polymeric chain depending on the desired molecular weight. Therefore, the viscosity of the silicone is related to its degree of polymerization, i.e., the length of the polymer chain (proportional to the molecular weight). That is, the higher the degree of polymerization, the higher the viscosity (Hardman & Torkelson, 1986).
In plastination, the most important external factor influencing the viscosity of silicone is temperature (Monteiro et al., 2018; Monteiro, 2020). In polymer chemistry, molecular weight is an important parameter with direct relationships with polymer length and viscosity (Monteiro et al., 2018; Monteiro, 2020). A decrease in temperature leads to an increase in viscosity of the polymer, and the more viscous the silicone, the lower its ability to flow into the tissue (Hardman & Torkelson, 1986).
One of the polymers most used worldwide in the plastination technique is Biodur® S10 silicone, which was developed and tested for this technique in Germany (https://www.biodur.de/). This polymer has a viscosity of 470 mPa.s at 20° C (Monteiro et al., 2018; Monteiro, 2020). In Brazil, there are some reports of the use of silicones from the company Polisil® (https://polisil.com.br/) for the plastination technique. However, there has been little research that evaluates its potential as an alternative for the technique. The two main silicones marketed by the company are P1 and P10, with viscosities of 100 and 1330 mPa.s, respectively, at 20 °C (Monteiro et al., 2018). The trials of P1 and P10 silicones in the plastination technique was also mainly carried out with the aim of finding an alternative polymer to Biodur for use in Brazil and Latin America. Monteiro et al. (2018) measured the viscosities of silicones P1 and S10 at the room and cold impregnation temperatures used in this work, which are: 1160 and 378 mPa.s in CT and 410 and 83 mPa.s in RT for S10 and P1, respectively.
Polymer viscosity is an important variable in the level of shrinkage observed during impregnation (Oliveira et al., 2009), as well as impregnation rate and temperature, type of biological tissue, contact surface of specimens, and others (Pereira-Sampaio et al., 2011; Judas et al., 2012; Starchik & Henry, 2015; Sora et al., 2015). Because tissue shrinkage is one of the drawbacks of plastination, several researchers have sought ways to overcome or, at least, minimize shrinkage (Adds, 2017; Owolabi et al., 2019; Ottone et al., 2020; Parsai et al., 2020).
The influence of temperature on viscosity of the three silicones (Biodur® S10, Polisil® P10 and P1) used in plastination was extensively studied by Monteiro and co-workers, (2018). The authors suggested that knowledge of the physicochemical characteristics of the silicone (such as temperature and chain length) and its dynamic viscosity are helpful in choosing the ideal silicone for use in cold or room temperature plastination techniques, or for different anatomical parts and types of biological tissue, avoiding tissue shrinkage beyond what was expected, and other visual changes, such as “distortion” and color change.
Although some studies have already evaluated the influence of different silicone impregnation temperatures (CT and RT) in relation to tissue shrinkage, there is a lack in the literature of research relating shrinkage to the use of silicones with different viscosities and impregnation rates. The hypothesis to be tested is that silicones with lower viscosities tend to shrink the tissue less during the impregnation step. Probably, the greater fluidity would facilitate the entry of the polymer into the biological tissue and, conversely, more viscous silicones would have greater resistance to entering the tissue, causing greater tissue shrinkage (Monteiro, 2020).
The objective of this work was (1) to complement our previous research (Monteiro et al., 2018) testing the influence of the viscosity of three different silicones on tissue shrinkage during forced impregnation, and (2) to find alternative silicone options to be used at different temperatures, which produce less shrinkage.
Twenty-four bovine kidneys donated by Frigorífico Cariacica S.A. (Cariacica, Espírito Santo – Brazil) were used. The use of specimens was approved by the Animal Ethics Committee of Federal University of Espirito Santo (UFES), registered under No. 31/2019. After fixation in 10% formalin by immersion for one month, the kidneys were divided into two groups: 12 for impregnation at room temperature (RT), and 12 for impregnation at cold temperature (CT). The two groups were then subdivided into three subgroups with four kidneys each and labeled for the silicone to be used: S10, P10 or P1 (Table 1).
| Temperature of Impregnation | Silicone | Subgroups/ Sample Number |
|
RT (12) |
S10 | RT-S10 (4) |
| P10 | RT-P10 (4) | |
| P1 | RT-P1 (4) | |
|
CT (12) |
S10 | CT-S10 (4) |
| P10 | CT-P10 (4) | |
| P1 | CT-P1 (4) |
All kidneys were dehydrated in four baths of pure cold acetone (-25 °C); the specimen to acetone ratio was 1:5 v/v. The acetone baths were changed every seven days. Acetone purity was measured using an acetonometer, and recorded after each bath. The specimens were considered dehydrated when the water concentration in the acetone bath was less than 1%. After dehydration, the volume of the specimens was measured and recorded, and forced impregnation followed. The subgroups RT-P1, RT-P10 and RT-S10 were impregnated with the mixture of the chosen silicone and their respective cross-linkers (S6 - Biodur® or TES - Polisil®) in the ratio of 100:8 by weight, at a temperature of 25 ± 2 °C. The CT-P1, CT-P10 and CT-S10 subgroups were impregnated with the mixture of the silicone of interest with their respective catalysts (S3 - Biodur® or DBTL - Polisil®) at a ratio 100:1 by weight, at a temperature of -15 ± 2 °C. Preliminary physical-chemical tests carried out in the laboratory indicated that the catalysts and crosslinkers from both companies have the same components and in similar proportions.
On the first day of impregnation, the kidneys were submerged in the silicone-mix, ensuring that all specimens were fully covered by the polymer. Vacuum started on the second day and was increased daily, slowly, and progressively. During the day, the bubble pattern was checked about 3 times and adjusted if necessary. The parameter for vacuum adjustment was observation of acetone bubble production and pattern at the same observation point (de Jong & Henry, 2007; Raoof et al., 2007; Henry et al., 2019). The pattern of bubbles that erupted in the silicone was chosen for monitoring the progression of vacuum (with verification using a manometer), in preference to the established adjustment of the vacuum by watching a manometer, since the silicones tested have very different viscosities and, with that, different dynamics of impregnation. This idea is supported by the works of de Jong & Henry (2007) and Henry (2019), whose authors claim that “speed of lowering the pressure in the vacuum chamber is dependent on temperature and/or viscosity of the reaction-mixture. At higher temperature or lower viscosity, pressure can be lowered faster because of the decreased viscosity of the polymer-mix”. In the literature, some authors standardize the pressure adjustment (vacuum) during the forced impregnation step, but the protocol is for a specific silicone in each case (Biodur products, for example). In this sense, with the standardization of the increase in vacuum based on bubbles, it was intended to apply to all test groups the same rate of vaporization of acetone and, consequently, the same rate of impregnation. The appearance of bubbles on the surface of the silicones started at approximately 560 mmHg for silicones in RT and 360 mmHg for CT.
Bennert and digital manometers were used to monitor vacuum. When impregnation bubbles ceased to appear on the surface of the silicone, and maximum vacuum (6 mmHg) was reached, impregnation was considered finished. Kidneys were impregnated in duplicate for each subgroup, that is, two at a time.

Figure 1. Analytical glassware used to measure kidney volume before and after impregnation
Twenty-four hours after impregnation, the specimens were removed from the chamber and left to drain the excess surface polymer at room temperature (25 °C ± 2). The excess silicone was wiped off daily, until the specimen was dry (von Hagens et al., 1987; Henry et al., 2019). Drainage time (i.e., until the specimen loses the thin fluid surface layer of silicone) was recorded. The moment between the removal of the kidneys from the vacuum chamber and the beginning of hardening of the silicone took between 3 to 6 days, depending on the silicone used. After drying to the touch, the kidneys impregnated in CT were cured with volatilization of the cross-linker from each manufacturer (TES – Polisil, S6 - Biodur) for 2 days and those impregnated in RT were brushed with their catalyst (DBTL – Polisil, S3 - Biodur) and covered with plastic for 3 days.
Since the difference in volume is the best measure to quantify shrinkage of specimens in plastination (Brown et al., 2002), the volume of each dehydrated kidney was measured and recorded immediately before impregnation and after drainage. For the measurement of volume, appropriate analytical glassware (beakers and graduated cylinders) was used. The kidneys were placed in a calibrated beaker, and it was filled with acetone from the last dehydration bath (before impregnation) or water (after impregnation) to its maximum volume mark (2 liters) at room temperature (20-25 °C). The liquid was then transferred to a graduated cylinder for volume measurement, as the cylinder is more precise and accurate. The kidney volume was calculated from the difference between the total volume (2 liters) and the volume measured in the graduated cylinder (Fig. 1). The percentage shrinkage of each kidney was calculated using the mathematical formula:
| (Vol (before impregnation) - Vol (after drainage) / Vol (before impregnation)) x 100 = % shrinkage |
After volume measurement, curing was carried out.
The room temperature kidney subgroups were cured with their respective catalysts, DBTL (Polisil®) and S3 (Biodur®), while the cold temperature subgroups received their respective cross-linkers, S6 (Biodur®) and TES (Polisil®).
The homogeneity of variance and normality of the data were verified with the Levene, Shapiro-Wilk and Kolmogorov-Smirnov tests (significance with p-value > 0.05). In order to compare the effect of the forced impregnation on the shrinkage of the specimens, the data (volumes before and after drainage) were compared using one-way ANOVA. In order to compare the effect of impregnation temperature (CT or RT), and the silicone used (S10, P1 or P10), on the shrinkage of the specimens, a two-way ANOVA, followed by the Duncan test were used. Data were analyzed using IBM SPSS Statistics for Windows, Version 22.0 software, with the results expressed in mean ± standard deviation of the mean (SDM). Values were considered statistically significant if the “p” values were equal to or less than 5% (p≤0.05).
Through the averages of the volumes before and after impregnation, and the standard deviation values of the mean, it was possible to calculate the % shrinkage (mL), as shown in Table 2.
| Forced Impregnation | |||||
| Average Volume | |||||
| Temperature | Silicone | Before ± SDM | After ± SDM | ∆ (mL) | % Shrinkage |
| Room
(25 ± 2 °C) |
P10 | 435 ± 77 | 263 ± 38 | 172 | 38.90 |
| S10 | 498 ± 50 | 410 ± 58 | 88 | 17.80 | |
| P1 | 336 ± 40 | 320 ± 36 | 16 | 4.80 | |
| Cold
(-15 ± 2 °C) |
P10 | 516 ± 30 | 284 ± 77 | 232 | 45.40 |
| S10 | 500 ± 58 | 342 ± 13 | 158 | 30.90 | |
| P1 | 442 ± 98 | 375 ± 86 | 67 | 15.40 | |
All subgroups showed normality and homogeneity of variance (p-value > 0.05). In this sense, in order to verify whether the variation in volume before and after impregnation was significant for each subgroup, the volumes before and after forced impregnation were compared by means of one-way ANOVA, to evaluate the effect of this step (Fig. 2). All subgroups show a significant shrinkage rate when comparing initial and final volumes [p-value = 0,000].
As shown in the results of the one-way ANOVA test performed to verify whether the variation in volume before and after impregnation was significant for each subgroup, all subgroups showed significant shrinkage when comparing initial and final volume (Fig. 2).
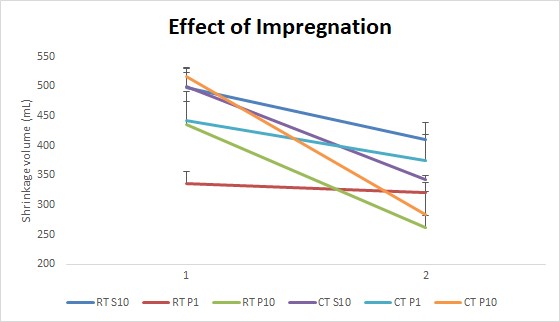 Figure 2. Effect of forced impregnation on the mean volume of the specimen, before (1) and after (2) impregnation using different silicones at room temperature (RT) or cold temperature (CT) |
The data dispersion of the shrinkage values of each subgroup was verified through the maximum and minimum values of the shrinkage found from the kidneys after the impregnation stage (Table 3). The maximum and minimum shrinkage values (%) of the kidneys for each silicone and impregnation temperature are recorded in Table 3.
| Temperature | Silicone | Kidney Shrinkage (%) | |
| Minimum | Maximum | ||
| Room | P10 | 31.3 | 47.9 |
| S10 | 12.7 | 20.9 | |
| P1 | 1.60 | 6.70 | |
| Cold | P10 | 33.7 | 49.1 |
| S10 | 22.8 | 38.2 | |
| P1 | 11.0 | 18.8 | |
The effects of the impregnation temperature (CT or RT) and silicone variety (S10, P1 or P10) on tissue shrinkage were statistically analyzed using the two-way ANOVA followed by two-way Duncan's test. The ANOVA test showed that there was no interaction between the impregnation temperature and the different silicones analyzed [Temperature of impregnation temperature: F(1.23) = 12.44, p = 0.002; Silicone: F (1.23) = 47.69, p = 0.00; Interaction: F (1.23) = 1,128], that is, the factors ‘type of silicone’ and ‘impregnation temperature’, separately, influence the final result of the specimen, in this case, on shrinkage.
Among the experimental subgroups, differences in tissue shrinkage were observed by the multiple comparison test (Duncan’s test), as shown in Figure 3. P10 silicone impregnation, both at room and at low temperature modified the initial volume, leading to a greater percentage of shrinkage than in the other groups (p<0.05). In CT, silicone P1 also showed the lower shrinkage, but did not show significant differences when compared with the S10 silicone at RT. Comparing the average shrinkage values obtained with impregnation at room temperature and cold temperature, for each type of silicone, it is clear that the variation of shrinkage was inversely proportional to their respective viscosities, since P1 has the lowest viscosity and P10 the highest (Fig. 3).
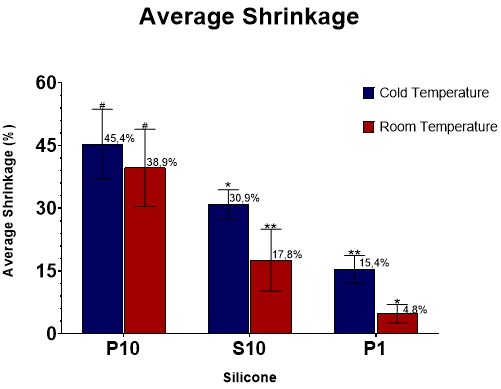 Figure 3. Effect of impregnation temperature on mean % shrinkage of kidneys impregnated with different silicone-viscosities at room temperature (RT) or cold temperature (CT) - two-way ANOVA followed by Duncan's test. * - Different from all subgroups; ** - Similar to each other and different from the other subgroups; # - Similar to each other and different from other subgroups |
Comparisons of viscosity and shrinkage values for the silicones tested at both temperatures are shown in Figures 4 and 5. Viscosity values shown in Figures 4 and 5 were taken from Monteiro (2018).
 Figure 4. Comparison of the viscosity values (mPa.s) vs shrinkage (%) of the three silicones at room temperature (25 ± 2 ºC). The differences between subgroups were statistically significant (p<0.05); viscosity values from Monteiro et al. (2018) |
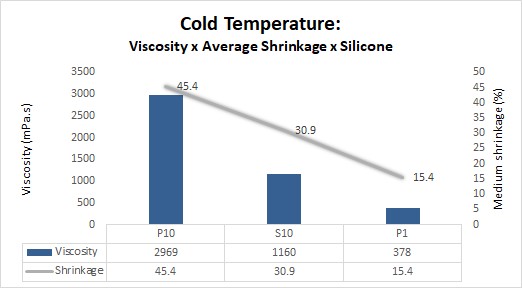 Figure 5. Comparison of the viscosity values (mPa.s) vs shrinkage (%) of the three silicones at cold temperature (-15 ± 2 °C). The differences between subgroups were statistically significant (p<0.05); viscosity values from Monteiro et al. (2018) |
The direct correlation of the values of tissue shrinkage and viscosity of the silicones at the different impregnation temperature was not performed, since, in addition to viscosity, the imposed temperature can affect other variables, including the tissue biochemistry itself (Monteiro, 2020). Since this can directly affect the rate of shrinkage of the specimens, doing direct correlation with viscosities would not be meaningful. It is also worth mentioning that the viscosity of the silicone (either by type or by temperature change) is just one of the factors that influence tissue shrinkage rates, especially when comparing data between different impregnation temperature (CT and RT), since other factors (such as temperature) can affect tissue biochemistry and hence shrinkage.
As seen in Figures 3 and 4, there is a direct relationship between silicone viscosity and shrinkage rate, since the higher the viscosity, the greater the shrinkage within the same impregnation temperature.
Figures 5 and 6 show two of the four kidneys of each subgroup (RT-P1, RT-S10, RT-P10, CT-P1, CT-S10 and CT-P10) before and after impregnation with the different silicones.
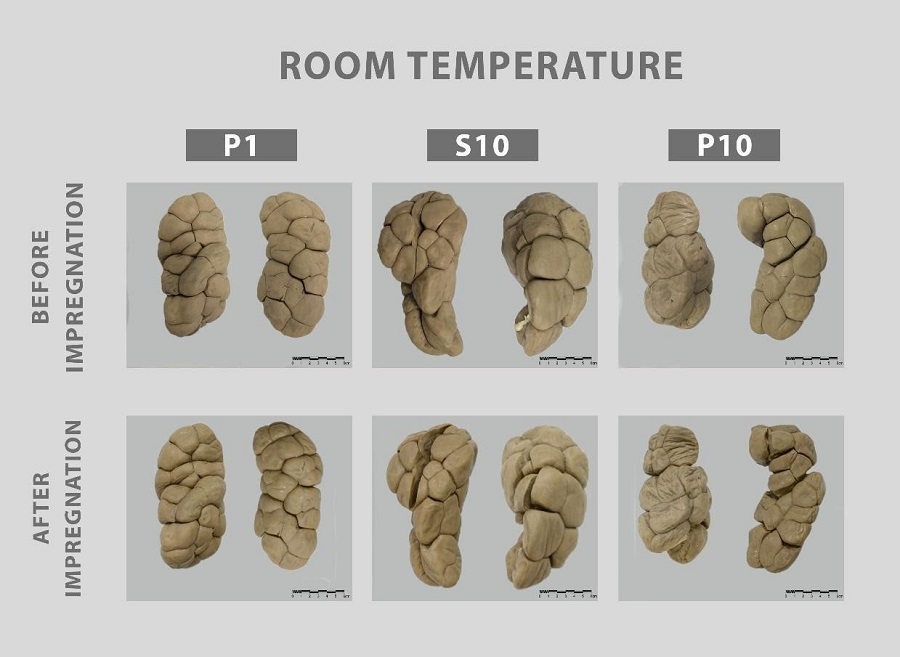 Figure 6. Before and after results of impregnation of the bovine kidneys with the different silicones at room temperature (25 ± 2 °C) |
 Figure 7. Before and after results of impregnation of the bovine kidneys with the different silicones at CT (-15 ± 2 °C) |
When comparing the subgroups, it was noted that at RT, shrinkage of the impregnated kidneys with P10 silicone was on average 2.2 times greater than S10, and 8 times greater than CT - P1; when impregnating with silicone P10, the average specimen shrinkage was 1.5, and 3 times more than those impregnated with S10 and P1, respectively. When shrinkage was analyzed, the difference between impregnation with RT and CT for all silicones, shrinkage values were 1.2, 1.8, and 3.2 times greater for silicones P10, S10, and P1, respectively.
Furthermore, using the bubble pattern for vacuum control described in this study, impregnation with silicone P10 at RT took an average of 14 days, and 21 days at CT, while with the reference polymer (S10) it took 12 days at RT and 19 days at CT, and with the polymer P1 there was a shorter impregnation time, 10 days at RT and 17 days at CT. The difference in impregnation time for different silicones is an interesting finding, as it shows that less viscous silicones take less time to be impregnated, speeding up plastination and saving resources (electrical energy and vacuum pump lifetime). Furthermore, the impregnation step in CT was 1.5, 1.58, and 1.7 times longer when compared with RT for P10, S10, and P1 silicones, respectively. The impregnation times recorded in this work agree with the work of Starchik & Henry (2015), which showed that the impregnation in CT is 1.62 times greater than in RT.
Considering the silicone used, drainage time was also different. Kidneys impregnated with P1 dried faster (overnight), while those impregnated with P10 took longer (about 2 days). In this analyzed parameter, the S10 had intermediate results. Probably, in the same way that more fluid silicones can permeate tissues more easily during impregnation, their viscosity also affects drying of the surface of the specimen.
Bovine kidneys are lobulated and were excellent specimens to be used in a shrinkage study. The increased depth and width of the grooves between lobes clearly demonstrated the degree of shrinkage.
Figures 4 and 5 reveal the higher the viscosity of the silicone, whether due to molecular chain length or temperature, the greater the tissue shrinkage of the specimen. Figure 3 indicates that the higher the viscosity of the silicone impregnation-mix, the lower the difference in shrinkage in the two temperature conditions (RT and CT). This phenomenon is probably due to the dynamics of the impregnation: very viscous silicone will promote a greater shrinkage, even at room temperature.
Using multiple comparison tests, statistical analysis showed that the impregnation with silicone P1 at room temperature yielded the least shrinkage. Shrinkage after cold temperature impregnation using silicone P1 did not present significant differences when compared to impregnation using silicone S10 at room temperature (Figs. 3, 6, 7). Room temperature impregnation drains 4.7 times faster when compared with CT (Starchik & Henry, 2015). Considering that the cure of kidneys impregnated in CT occurred in 12-24 hours and in RT it took 48-72 hours, the results corroborate the work of Starchik & Henry (2015), in which it was found that the curing process in CT impregnation is up to 3 times faster than impregnation at RT.
When comparing the viscosity of silicones at different temperatures, shrinkage is not directly proportional. According to the silicone viscosity results demonstrated by Monteiro et al., (2018) and the shrinkage results reported here, when comparing S10 and P1 silicones at room temperature, both the viscosity and the shrinkage values practically quadruple. At low temperature, comparing S10 and P1 silicones, the viscosities triple, and the shrinkage value doubles. In the comparison between P10 and S10 at room temperature, while the viscosity has a difference of almost three times, the shrinkage only doubles. Between P10 and S10, the viscosity is different by two and a half times, and the shrinkage has a difference of approximately one and a half times. These data corroborate that temperature is a factor that influences the specimen’s final shrinkage in an important, non-proportional way.
Comparing before and after images of the kidneys impregnated with the three silicones, P10 presents more evident visual shrinkage (Figure 6). This is due to the fact that it has the highest viscosity among the tested silicones, 1183 mPa.s at 25 °C, almost three times more viscous than S10, at the same temperature. Silicone S10 has intermediate viscosity between the tested silicones and, therefore, the results of shrinkage are greater than in P1 and less than that found with P10. The silicone viscosity values were from Monteiro et al. (2018).
As discussed earlier, the lower the silicone viscosity, the easier it can penetrate the deeper layers of the specimens, thereby reducing shrinkage. This is caused by the difference in speed of acetone escape and silicone penetration during impregnation, as pressure decreases. With a standardized impregnation rate from acetone volatilization (impregnation bubbles), if the silicone used is more viscous, the polymer permeation is slower as the acetone vaporizes, shrinking the tissue. In the same sense, if impregnation speed (acetone release) is too fast, the acetone leaves the tissue quicker than the viscous polymer can enter the tissue and shrinkage will occur (de Jong & Henry, 2007; Monteiro, 2020). To corroborate this idea, it is widely known that viscosity is an important factor in the diffusion of substances in biological tissues, as in the use of biological tissue fixing agents, since substances with higher viscosity take longer to enter biological tissues because they encounter greater diffusion resistance (Zeng et al., 2013; Paula, 2014). As it presents the lowest viscosity of the tested silicones (four times less viscous than S10 silicone), the P1 impregnation-mix specimens had the least amount of shrinkage.
Our findings on shrinkage of kidneys during impregnation agree with Starchik & Henry (2015), room temperature impregnation yielded less shrinkage when compared to cold temperature impregnation. Those authors found values of renal tissue shrinkage very similar to ours for S10, however they measured shrinkage from dehydration through curing (28.3% ± 5.68 for CT and 19.6% ± 4.11 for RT).
The CT impregnation reactive mixture gradually increases its viscosity over time due to the presence of the DBTL catalyst. This increase in viscosity during impregnation could affect the comparison of the shrinkage degree in RT and CT in this work. However, as seen in the work by Sora et al. (2015), when using low temperature (-25 °C), the viscosity of the reactive mixture remains almost the same during the first three weeks of impregnation.
Some limitations/observations of this work should be noted: (1) Although the statistical analysis of the results has shown relevant significance, it was understood that the sample number could be larger, which was not done to avoid overuse of chemical and biological material; (2) for a better standardization of the variables, it is understood that catalysts and crosslinkers from only one manufacturer could be used, but according to the technical sheets of the manufacturers of the tested silicones, these products are composed of the same chemical components in both companies (Polisil and Biodur); (3) the progression of vacuum application was dictated by the visualization of bubbles erupting on the silicone surface due to their different viscosities, although the literature usually uses standardization of vacuum application through established pressure reduction increments, as well as, monitoring bubble production, for specific silicones.
In conclusion, the use of low viscosity polymer such as P1 will probably have the least shrinkage during plastination at both impregnation temperatures (CT and RT). Furthermore, tissue shrinkage using P1 at cold temperature was lower than other silicones (S10 and P10), even at room temperature.
Adds PJ. 2017: Biodur® S10/S3 and S15/S3 at "Room Temperature": a viscosity study. J Plast 29(1): 15-18.
https://doi.org/10.56507/RNBU9088
Brown MA, Reed RB, Henry RW. 2002: Effects of dehydration mediums and temperature on total dehydration time and tissue shrinkage. J Plast 30(1):28-33.
https://doi.org/10.56507/XNQM4606
Chaynes P, Mingotaud AF. 2004: Analysis of commercial plastination agents. Surg Radiol Anat 26, 235-238 DOI. 10.1007/s00276-003-0216-9.
https://doi.org/10.1007/s00276-003-0216-9
Glover RA, Henry RW. 1998: Polymer preservation technology: Poly-Cur. A next generation process for biological specimen preservation. Abstract presented at The 9th International Conference on Plastination, Trois-Rivieres, Quebec, Canada, July 5-10, 1998. J Plast 13 (2): 39.
Hardman B, Torkelson A. 1986: Silicones. In: Mark HF, Bikales NM, Overberger CG, Menges, G (Eds). Encyclopedia of Polymer Science and Engineering, Vol 4. Wiley-Interscience, Pennsylvania, USA, p. 204.
Henry, RW. 2007: Silicone plastination of biological tissue: Cold-temperature technique North Carolina technique and products. J Plast 22:15-19.
https://doi.org/10.56507/DGZJ6845
Henry RW, von Hagens G, Seamans G. 2019: Cold temperature/ Biodur®/ S10/ von Hagens'-Silicone plastination technique. Anat Histol Embryol 48:532-538. DOI: 10.1111/ahe.12472.
https://doi.org/10.1111/ahe.12472
Jong K, Henry RW. 2007: Silicone plastination of biological tissue: Cold-temperature technique Biodur S10/S15 technique and products. J Plast 22: 2-14.
https://doi.org/10.56507/ZLMJ7068
Judas F, Palma P, Falacho RI, Figueiredo H. Estrutura e Dinâmica do Tecido Ósseo [Structure and Dynamics of Bone Tissue]. Apostila de apoio para os alunos do Mestrado Integrado em Medicina Disciplina de Ortopedia da Clínica Universitária de Ortopedia [support book for students of the Integrated Master in Medicine Discipline of Orthopedics at the University Clinic of Orthopedics], 2012. [In Portuguese].
Miles DC, Briston JH. 1975: Tecnologia dos Polímeros [Polymer Technology]. São Paulo: Polígono S.A. [In Portugese].
Monteiro YF, Juvenato LS, Bittencourt APSV, Siqueira BMM, Monteiro FC, Baptista CAC, Bittencourt AS. 2018: Influence of the temperature on the viscosity of different types of silicone. J Plast 30 (1): 4-9.
https://doi.org/10.56507/HETT9088
Monteiro YF. 2020: Plastinação com silicone de baixa viscosidade: estratégia para uma menor retração tecidual [Plastination with low-viscosity silicone: strategy for less tissue shrinkage]. Masters' dissertation (Master's in Biochemistry and Pharmacology) - University of Espirito Santo, Vitória. [In Portugese]
Oliveira RC, Barros STD, Rossi RM. 2009: Aplicação da metodologia Bayesiana para o estudo reológico da polpa de uva [Application of Bayesian methodology for the rheological study of grape pulp]. Rev Bras de Prod Agro 11(1): 73-80. [In Portugese]
https://doi.org/10.15871/1517-8595/rbpa.v11n1p73-80
Ottone NE, Baptista CAC, Del Sol M, Ortega MM. Extraction of DNA from plastinated tissues. Forensic Science International v. 309, 2020.
https://doi.org/10.1016/j.forsciint.2020.110199
Owolabi JO, Adeteye OV, Fabiyi OS, Olatunji SY, Olanrewaju JA, Obaoye A. 2019: Comparative study of the outcome of forced impregnation of whole brains at cold temperature, and an alternative diffusion/impregnation process. J Plast 31(1): 19 -24.
https://doi.org/10.56507/RTIG2240
Parsai S, Frank WP, Baptista CAC. 2020: Silicone plastination of brain slices: using sucrose to reduce shrinkage. J Plast 32 (1):31-36.
https://doi.org/10.56507/IDZK2594
Paula, RC. 2014: Análise morfológica da propriedade de compostos vegetais na conservação de tecidos cadavéricos [Morphological analysis of the property of plant compounds in the conservation of cadaveric tissues]. Doctoral Thesis (Doctorate in Anatomy of Domestic and Wild Animals) - University of São Paulo, Sao Paulo. [In Portugese].
Pereira-Sampaio MA, Marques-Sampaio BPS, Sampaio FJB, Henry RW. Shrinkage of Renal Tissue after Impregnation via the Cold Biodur Plastination Technique. The Anatomical Record v. 294, p. 1418-1422, 2011.
https://doi.org/10.1002/ar.21432
Raoof A, Henry RW, Reed RB. 2007: Silicone plastination of biological tissue: room-temperature technique Dow/Corcoran technique and products. J Plast 22 (1): 21-25.
https://doi.org/10.56507/AWAC9285
Sora C, Banciu CD, Boia M. 2015: Silicone (BIODUR) viscosity and impregnation in plastination. Mater Plast 52(4): 593-595.
Starchik D, Henry RW. 2015: Comparison of cold and room temperature silicone plastination techniques using tissue core samples and a variety of plastinates. J Plast 27(2): 13-19.
https://doi.org/10.56507/NTQJ7764
Starchik D, Henry RW. 2019: Room temperature/Corcoran/Dow Corning™-Silicone plastination process. Anat Histol Embryol 48: 539-546.
https://doi.org/10.1111/ahe.12505
von Hagens G, Tiedemann K, Kriz W. 1987: The current potential of plastination. Anat Embryol 175(4):411-421. DOI: 10.1007/BF00309677
https://doi.org/10.1007/BF00309677
Zeng F, Yang W, Huang J, Chen Y. 2013: Determination of the lowest concentrations of aldehyde fixatives for completely fixing various cellular structures by real-time imaging and quantification. Histochem Cell Biol 139(5): 735-749.
https://doi.org/10.1007/s00418-012-1058-5