1Department of Morfology, Federal University of Espirito Santo, Brazil
2Biochemistry and Pharmacology Graduation Program, Federal University of Espirito Santo, Brazil
3 Department of Fisiology Science, Federal University of Espirito Santo, Brazil
4 Department of Medical Education, College of Medicine and Life Sciences, University of Toledo, Ohio USA.
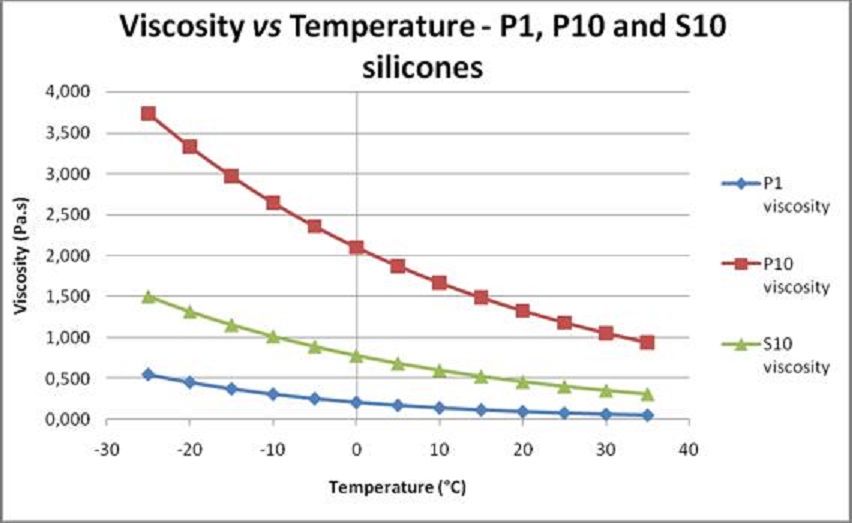
The objective of this work was to test the influence of temperature on the viscosity of three silicones of different molecular weights (Biodur® S10, Polisil® P10 and P1) commonly used in the plastination technique. For the study, the RheolabQC model rotational rheometer was used to measure the dynamic viscosities of the chosen polymers at the following temperatures: -5, 0, 5, 10, 15, 20, 25, 30 and 35 °C. From the 9 measurements of viscosities obtained from each sample, a viscosity vs. temperature graph was constructed. The equation of the dynamic viscosity curve of each polymer was analyzed. Polisil® P1 silicone had a much lower viscosity compared to other silicones (about 80 mPa.s at 25 °C and 550 mPa.s at -25 °C). Polisil® P10 silicone presented the highest viscosity of the polymers analyzed (approximately 1180 mPa.s at 25 °C and 3730 mPa.s at -25 °C). The Biodur®'s S10 silicone showed an intermediate viscosity (about 410 mPa.s at 25 ° C and 1500 mPa.s at -25 °C). We conclude that Polisil® P1 silicone presented the best physico-chemical characteristics of the tested silicones for plastination, because it has high fluidity and low viscosity. It is noteworthy that the viscosity of Polisil® P1 in cold impregnation temperature (-15 °C) is still lower than the viscosity of the Biodur® S10 (control) at room temperature (20-25 °C). We also conclude that the knowledge of the intrinsic and extrinsic physicochemical characteristics of the silicone and its dynamic viscosity is helpful in choosing the ideal silicone for use in the cold or room temperature plastination techniques.
Viscosity, PDMS, temperature, silicone, plastination
Athelson S Bittencourt, Federal University of Espirito Santo, Health Sciences Center, Marechal Campos Avenue, 1468 Maruipe, Vitoria- ES, Brazil, Zip code: 29.043-900, Fax: +55 27 33357358, athelson@hotmail.com

![]()


The term silicone, or polysiloxane, was created in 1901 to describe mixed polymers of organic and inorganic materials, whose crude formula is [R2SiO]n, where R are organic groups such as methyl, ethyl and phenyl. These polymers are inert, odorless, insipid and resistant to decomposition by heat, water or oxidizing agents, besides being good electrical insulators. They exhibit good resistance to high or low temperatures (-45 to +145 °C) and have viscosities between 10 and 100,000 millipascal second (mPa.s) (Milles et al., 1975).
A polymer is a macromolecule formed by repetitive structural units, joined together by covalent bonds. In silicone, the repeating unit is siloxane (subgroup of silica compounds containing Si-O bonds with organic radicals attached to the molecule) (Carraher, 2003).
Silicones, technically, are polymers that can be obtained basically in three steps: synthesis of chlorosilanes, hydrolysis of chlorosilanes to silanols and polymerization of silanols. The first step occurs in a fluidized bed of metal silicon powder treated with a flow of chloromethane, generally at temperatures of 250 to 350 °C and pressures of 1 to 5 atm. A mixture of different chlorosilanes is obtained mainly containing the dimethyldichlorosilane (Me2SiCl2), which represents the most important monomer for the subsequent steps. In the second step, polydimethylsiloxanes are obtained by the hydrolysis of dimethyldichlorosilane, in the presence of excess water (Hardman, 1989).
The products of this reaction are readily condensed, thus leading to a mixture of linear and cyclic silicones. The linear and cyclic oligomers obtained by hydrolysis of dimethyldichlorosilane have still very short chains, for most applications. In the third step, they must be condensed (in the case of linear ones) or polymerized (in the case of cyclic ones), to obtain macromolecules of satisfactory lengths (Hardman, 1989). This last step is decisive for the determination of the viscosity of the final product, since the viscosity of the silicones is directly related to their degree of polymerization (n). Depending on the size of the polymer chain, the silicone can be produced in three forms: liquid, gel and cohesive (Hardman, 1989).
Viscosity is a characteristic of liquids that is related to their ability to flow. The greater the viscosity of a liquid (or a solution), the greater the difficulty of the liquid to flow and more "viscous" the liquid is. One of the main external factors influencing the viscosity of a silicone is the temperature (Oliveira, Barros and Rossi, 2009). The viscosity is directly proportional to the internal friction of the silicone, and friction originates from the pulling force of the silicone molecules themselves. As temperature increase, this pulling force decrease, causing viscosity reduction. This reduction of viscosity occurs due to the increase of the intermolecular distances of the silicone by the higher kinetic energy (caused by the heating), reducing the attraction forces and, consequently, the friction of molecules, allowing a faster flow (lower viscosity) (Granjeiro et al, 2007).
For the rheological study of liquids, two factors are of great importance and should always be observed: shear stress and shear rate. Shear stress is a type of stress generated by forces applied in opposite orientation, but in similar directions in the analyzed material. On the other hand, shear rate or deformation rate is defined by the variation of the shear deformation in relation to the time (Shiroma, 2012).The concepts of shear stress (applied force) and shear rate (velocity gradient) are used to describe the deformation and flow of a fluid. Fluids in which the shear stress is directly proportional to the rate of deformation are called Newtonian fluids, and the viscosity is a constant for these fluids. However, if the shear stress is not directly proportional to the shear rate, the fluid is termed non-Newtonian; therefore, the viscosity varies according to the shear stress applied to the fluid (Schramm, 2006).
The main silicone used in the plastination process is polydimethylsiloxane (PDMS), which is a linear polymer whose radicals are methyl groups (Chaynes and Mingotaud, 2004). A literature search on the subject of viscosity of silicones for plastination reviewed a lack of research in this area. This study aimed to show the characteristics of three silicones of different molecular weights (Biodur S10, Polisil P10 and P1), and the influence of the temperature in their viscosity. Knowledge obtained in this study will allow us to better understand the variables influencing the impregnation process.
The RheolabQC rotational rheometer, manufactured by the Austrian multinational Company Anton Paar, was used to test the influence of temperature on the viscosities of the silicones. The equipment was used with a coaxial cylinder measurement system to measure the dynamic viscosities of the polymers Biodur® S10, Polisil® P10 and P1 in the following temperatures: -5, 0, 5, 10, 15, 20, 25, 30, 35 °C. As recommended by the manufacturer protocol, the samples of silicones were transferred one by one to a specific vessel for use in the rheometer with a cylindrical rod rotating within the sample, thus generating a shear in the fluid. The vessel was attached to the measuring head of the rheometer. In addition to the dynamic viscosity and temperature, the apparatus also measured the shear rate and the shear stress. The apparatus has a cooling and heating system coupled to the samples, with the minimum and maximum temperature reached varying from -5 to 80 °C.
The dynamic viscosities of the three silicone samples were measured in 9 different temperatures, and at each pre-programmed temperature, the device made 100 measurements of the actual temperature and its respective viscosity, with the shear rate varying from 100 to 600 seconds-1 (s-1). The shear rate and stress values were also measured. The data were plotted in the software Start Rheoplus® by the equipment itself and later exported to Microsoft Excel®.
The measurements obtained by the rheometer, i.e. the temperature averages and respective viscosities ± standard deviation, were calculated and plotted. An equation of the dynamic viscosity curve of the different types of silicone was generated.
Nine viscosity measurements were obtained from each sample. The temperature averages and their respective viscosities are showed in Table 1. A viscosity vs. temperature graph was constructed, and the dynamic viscosity curve equation of each polymer analyzed (Graph 1).
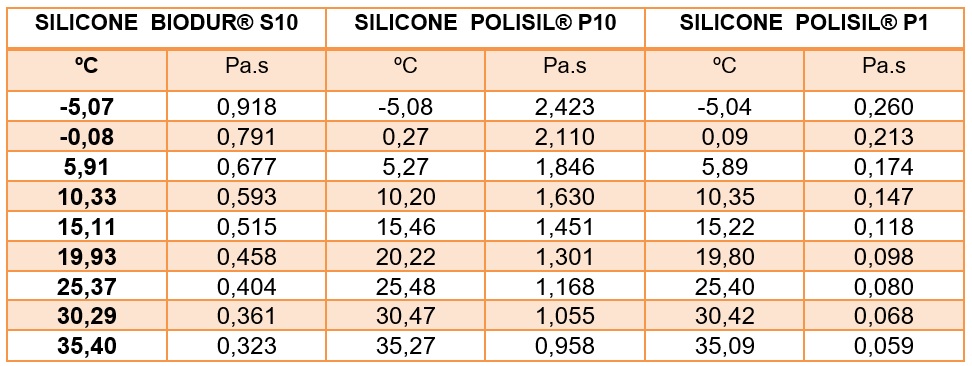 Table 1. Average values of the temperatures (°C) and respective dynamic viscosities (Pa.s) of the Biodur® S10, Polisil® P10 and P1 silicones measured by the RheolabQC model rotational rheometer. |
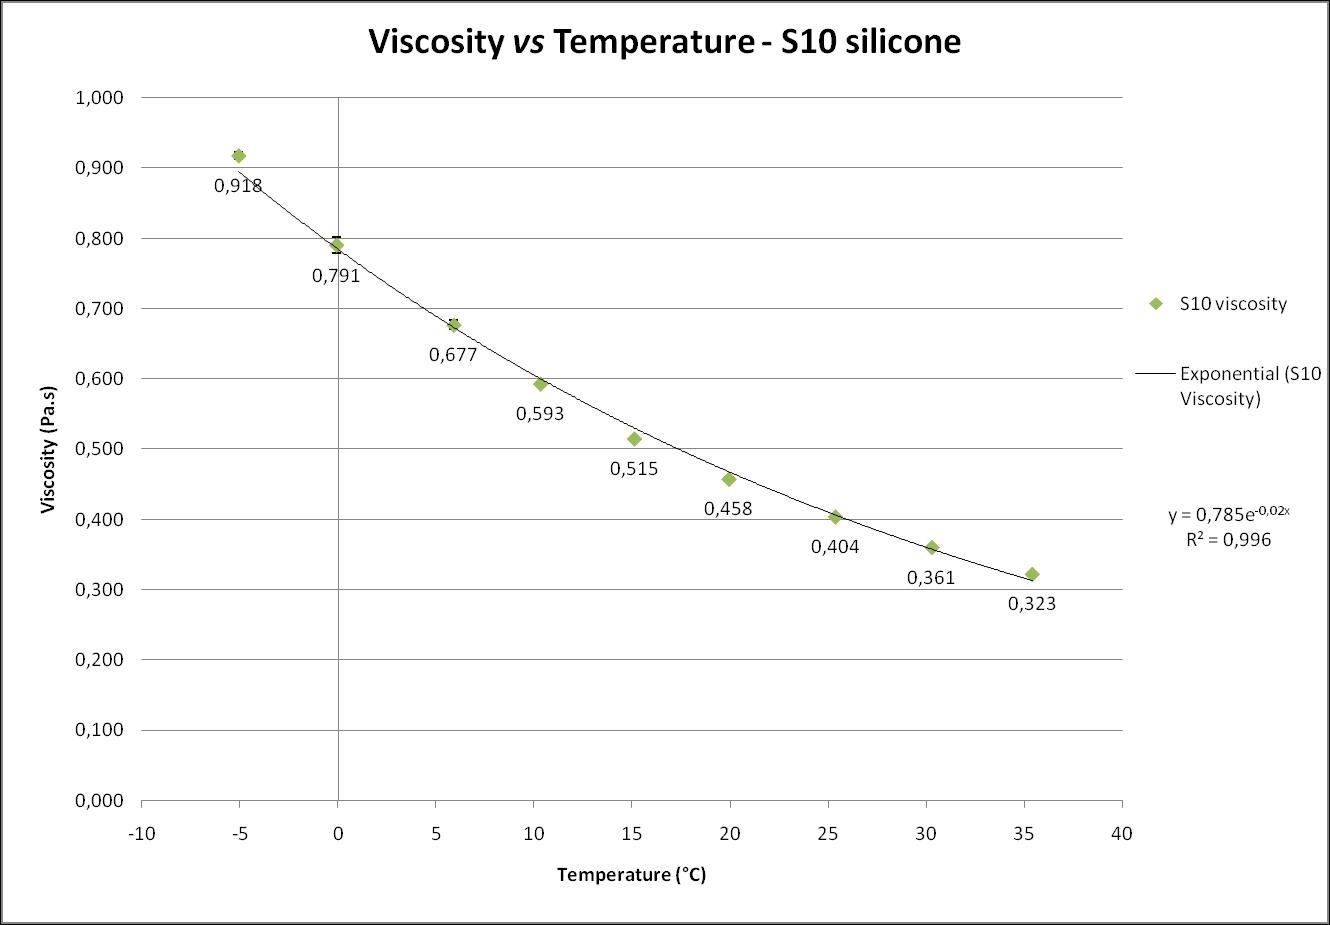 Graph 1. Viscosity dispersion vs temperature of polymer S10 ± standard deviation, including the curve equation (y), the coefficient of determination value (R2). |
The graphic of dispersion (XY) for each polymer from table 1 was ploted and its curve equations were calculated. The most suitable trend line that represents the viscosity points of the silicones is the exponential type (Giap, 2010; Romano et al., 2017). The use of 9 temperature points to generate the construction of a dispersion graph gave greater reliability to the results. Only three points in a scatter plot (XY) are sufficient to make a trend line, although the higher the number of measurements the more reliable the graph equation would be (Skoog, 2014). The determination of the curve equation of each silicone was done by Excel® software, through point-to-point regression. Graphs 1, 2 and 3 show the viscosity vs. temperature curves for each silicone. All graphs present decreasing of viscosity with the increasing of temperature.
Equations of the curves found for the silicones S10, P10 and P1 are y = 0,785e-0,02x, y = 2,102e-0,02x and y = 0,213e-0,03x, respectively. The degree of accuracy between the viscosity values calculated by the equation and the actual values can be demonstrated by the coefficient of determination (R2). R2 is a statistical real data points. An R2 of 1 indicates that the regression line perfectly fits the data.The closer R2 is to the 1, closer to real are the values calculated from the equations of each curve. The R2 values of the silicones graphs are: for P10 (0.997), S10 (0.996) and P1 (0.998). The values of R2 showed a degree of accuracy of the equation higher than 99.5%, a very high degree of association (Cosentino et al, 2013). The standard deviation was calculated for each point of the graph, however some deviations were too small to appear in the plot, denoting a high homogeneity and precision of the measurements obtained.
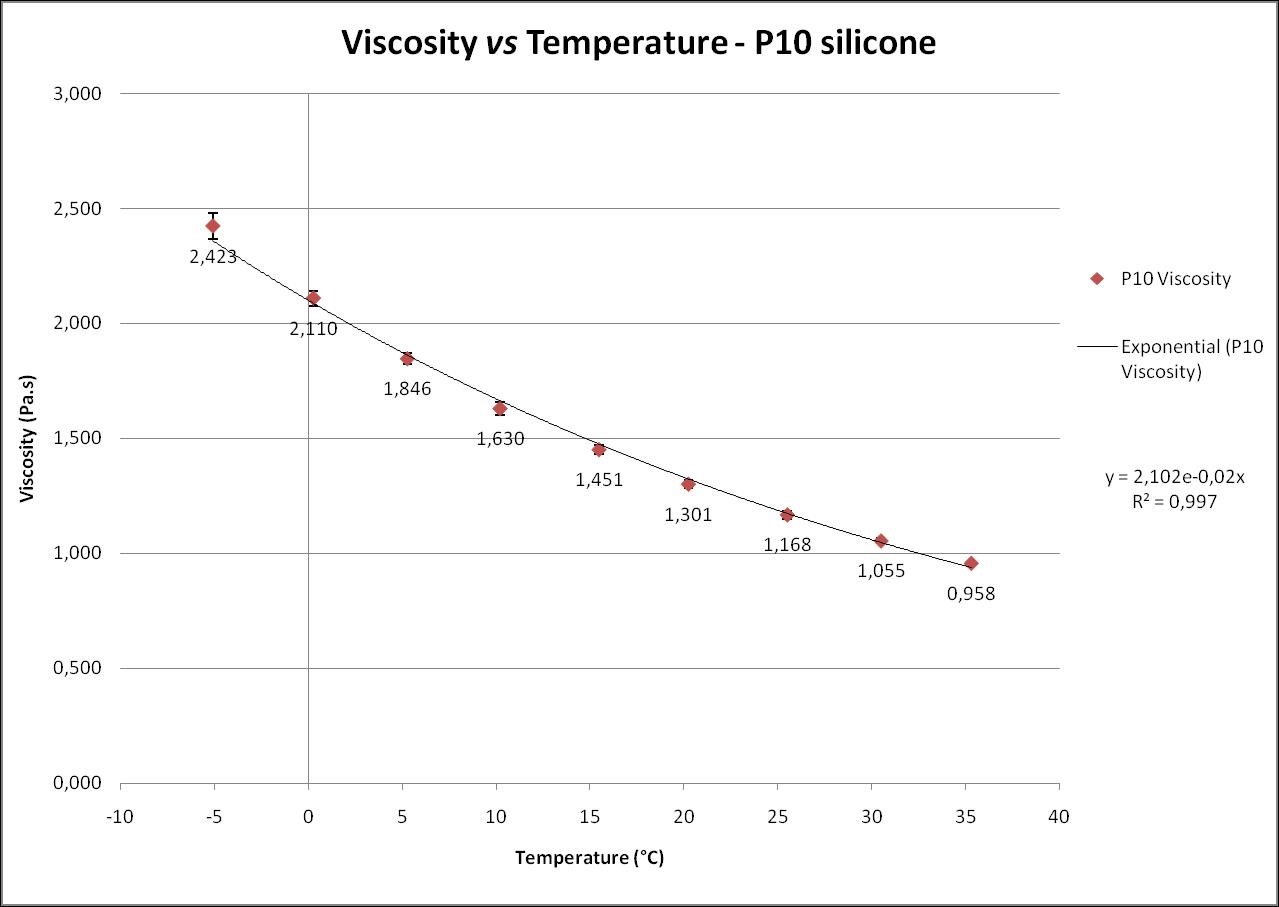 Graph 2. Viscosity dispersion vs temperature of polymer P10 ± standard deviation, including the curve equation (y), the value of the determination coefficient (R2). |
 Graph 3. Viscosity dispersion vs temperature of polymer P1 ± standard deviation, including the curve equation (y), the coefficient of determination (R2) value. |
The lack of linearity of the polymeric viscosity became more evident with the decrease in the viscosity of the silicone. The increase in the viscosity of the P10, S10 and P1 silicones from the maximum temperature (35 °C) to the minimum (-5 °C) measured on the rheometer was 153%, 184% and 340%, respectively.
Mathematical calculations were used to determine viscosities in temperatures outside the range of the equipment, but important for the plastination process. Plotting a value to the curve equation, an approximate value of viscosities of the silicone samples at any desired temperature is obtained. Table 2 shows the viscosity values of the three tested silicones at different temperatures, calculated from the curve equation for each polymer. Graph 4 shows the comparison of the viscosity curves of the silicones Biodur® S10, Polisil® P10 and P1 calculated from the curve equations of the silicones. Plotting the curves of the three types of silicones on the same graph make it possible to observe the viscosity and behavior of each silicone by changing the temperature (graph 4); therefore, the viscosity values were calculated from the curve equations of tested silicones.
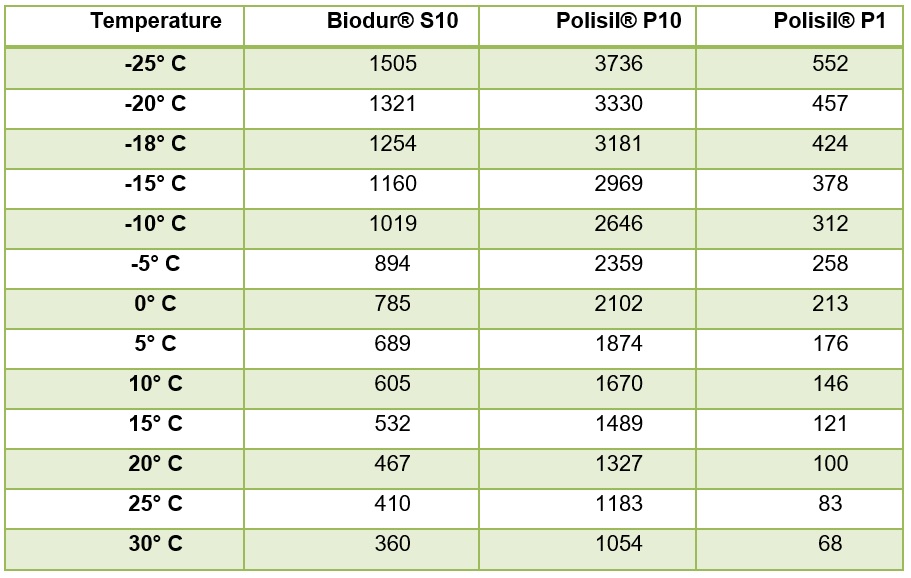 Table 2. Comparative viscosity values (mPa.s) calculated from the viscosity curve vs. temperature equation of the silicates S10, P10 and P1 at different temperatures of importance in plastination. |
 Graph 4: Comparison of the viscosity and temperature curves of the S10, P10 and P1 silicones. The viscosity values were calculated from each curve equation of the tested silicones. |
Knowledge of the influence of temperature on the viscosity of the silicones used in plastination is of great importance. Through a detailed study of this topic, several questions can be raised, such as: 1) what is the ideal temperature of the silicone in low temperature (LT) impregnation to decrease the retraction of the tissues and also to avoid hardening over time? 2) what is the ideal viscosity of the silicone for plastination at low and room temperatures? 3) what is the rheological behavior of silicones with different viscosities? 4) how does the viscosity of different silicones behave over time when in the reaction mixture for cold impregnation? and 5) does the temperature increase present a linear relationship with the viscosity increase?
The graphs (Graph 1, 2 & 3) for each silicone show the behavior of each polymer against the temperature gradient. An exponential increase in the viscosity of the silicones was observed with each temperature decrease.
The shear rate and shear stress measurements made by the apparatus were used to show that although the polymers are considered non-Newtonian fluids, the flow curves (shear rate vs. shear stress) of the tested silicones showed that they are closer to the Newtonian fluids’ features (Orrah et al., 1988; Schneider et al., 2009). As the flow curve (rate vs shear stress) becomes more linear, the closer the sample will be to the behavior of Newtonian fluids (Schramm, 2006).
The rheological characteristics of the three silicones used in plastination allow us to define their dynamic viscosity as the average of hundreds of measurements made at a given temperature. Viscosities remained constant or had a minimum change, regardless of the shear stress applied to the sample at a given temperature.
The different viscosities found in the tested silicones are determined by the degree of polymerization. The larger the silicone chain (P10> S10> P1), the more intermolecular bonds are made with adjacent molecules, and thus the less fluidity of the chain. The P10 has the largest chain (molecular weight), and consequently the highest viscosity. The different viscosities found within the same silicone sample were mainly found at different temperatures. Molecular cohesion is the dominant cause of viscosity, and, as the temperature of the silicone increases, these cohesive forces decrease, resulting in a decrease in viscosity (Granjeiro et al., 2007).
The curves of viscosity vs temperature of all analyzed silicones (Graphs 1, 2 & 3) has an exponential trend, showing that there is no linearity in the increase of the viscosity as a function of temperature, and that these values of viscosity grow with increasing rates. Therefore, the lower the temperature, the steeper the viscosity curve of the silicones becomes.
Silicone P1 has a higher proportional increase in viscosity with decreasing temperature, making its curve steeper in proportion to the others (Graph 3). However, P10 silicone has the highest viscosity and the lowest increase proportional to the decrease in temperature, that is, its curve is proportionally less steep when compared to the others (Graph 2).
Silicones of lower molecular weight are more sensitive to the temperature gradient, when compared to those of higher molecular weight. As expected, all graphs showed a strong negative correlation, that is, the increase on the temperature variable implies in a decrease on the viscosity variable.
At 35 °C (maximum measured temperature), silicones P10 and Biodur® S10 are respectively 16.2 and 5.5 X more viscous than P1. At -5 °C, P10 and Biodur® S10 are respectively 9.3 and 3.5 X more viscous than P1. The lower the temperature, the lower the difference between the viscosities of the silicones.
The viscosity data found are in accordance with the values provided by the manufacturers (Polisil® P10 = 1000-1500 mPas, Biodur® S10 = 450-600 mPas and P1 = maximum of 100 mPas, all at 25 °C).
The P1 Silicone appeared to be a good alternative to the reference silicone in plastination (Biodur® S10), since it has a viscosity at least 4 X lower at room temperature and 3 X in cold temperature, when compared to S10. The lower viscosity of P1 allows the silicone to flow more quickly and easily into the biological tissues during forced impregnation, therefore reducing shrinkage. The viscosity of P1 at cold temperature is less than the viscosity of Biodur® S10 at room temperature. Thus, plastination with the silicone P1 at low temperatures is likely to produce equal or less shrinkage than the Biodur® S10 at room temperature. The advantages attributed to room temperature plastination are described in the literature (Starchik and Henry, 2015b). It is known that the higher the viscosity of a silicone, whether by the size of the polymer chain or the reduction in silicone temperature, the greater the retraction of biological tissues in the forced impregnation step of plastination (Starchik and Henry, 2015b). The use of low molecular weight silicones may be preferable when a specimen with less shrinkage is sought. Specimens more prone to shrinkage, such as the brain and nervous system, will benefit from impregnation using silicones of shorter chains (more fluid).
From the results presented by this research, we conclude that the Polisil® P1 silicone presents the best physico-chemical characteristics of the silicones tested for the application in plastination, because it has high fluidity and low viscosity. It is noteworthy that the viscosity of P1 at cold impregnation temperature (-15 °C) is still lower than the viscosity of Biodur® S10 at room temperature
(20 - 25 °C).
Financial support
This research was supported by CNPq (458328/2013-8), undergraduate scholarship provided by UFES and graduate scholarship provided by CAPES.
Acknowledgements
Special thanks to the scientific collaboration with Processing and Characterization Laboratory/LabPetro - UFES
Carraher CE. 2003: Inorganic Polymers. In: Lagowski JJ, editor. Polymer Chemistry, 6th ed. Marcel Dekker, Inc, p 513-526.
Chaynes P, Mingotaud AF. 2004: Analysis of commercial plastination agents. Surg Radiol Anat 26: 235-238.
https://doi.org/10.1007/s00276-003-0216-9
Cosentino HM, Moura AAJ, Costa ACF. 2013: Estatística Básica para tomada de decisão. Volume 1: 1 ed. Rio de Janeiro: Editora Escola Nacional de Seguros.
Giap SGE. 2010: The Hidden Property of Arrhenius-type Relationship: Viscosity as a Function of Temperature. J Phys Sci 21(1): 29-39 (2010)
Granjeiro AA, Queiroz AJM, Figueiredo RMF, Mata MERMC. 2007: Viscosidades de polpas concentradas de figo-da-Índia. Revista Brasileira de Agrociência. Pelotas, 6 p.
Hardman B, Torkelson A. 1989: Silicones. Kroschwitz JI, editor. Encyclopedia of Polymer Science and Engineering.Silicones, 15th. John Wiley & Sons, p 204.
Oliveira RC, Barros STD, ROSSI RM. 2009: Aplicação da metodologia Bayesiana para o estudo reológico da polpa de uva. Revista Brasileira de Produtos Agroindustriais. Campina Grande, 8 p.
https://doi.org/10.15871/1517-8595/rbpa.v11n1p73-80
Romano MR, Cuomo F, Massarotti N, Mauro A, Salahudeen M, Costagliola C, Ambrosone L. 2017: Temperature effect on rheological behavior of silicone oils - a model for the viscous heating. J Phys Chem B.
https://doi.org/10.1021/acs.jpcb.7b03351
Schramm G. 2006: Reologia e Reometria. Artliber Editora Ltda., Sao Paulo.
Shiroma PH. 2012: Estudo do comportamento reológico de suspensões aquosas de bentonita e CMC: influência da concentração de NaCl. Master's Dissertation. Sao Paulo University.
Skoog, West, Holler and Crouch. 2006: Amostragem, Padronização e Calibragem. Fundamentos de Química Analítica, 8th Ed. Thomson, p 166-179.
Starchik D, Henry RW. 2015: Comparison of cold and room temperature silicone plastination techniques using tissue core samples and a variety of plastinates. J Plast 27(2):13-19 (2015)
https://doi.org/10.56507/NTQJ7764