1Department of Industrial and Systems Engineering, Oakland University, Rochester, MI 48309 USA
2Department of Neurosciences College of Medicine, University of Toledo, Ohio, USA
Objectives: Many researchers have shown that when used in conjunction, multiple pedagogic approaches increase student learning. Diagnostic imaging is used extensively to complement cadaveric dissection in courses such as neuroanatomy. This article provides a general framework to analyze and quantify the learning utility from combining multiple teaching methods for a richer learning experience. We present an example from neuroanatomy that combines the use of Magnetic Resonance Imaging and plastinated specimens.
Materials and Methods: Two brains, from female cadavers aged between 70-90 years of age, were removed from the body, fixed in 10% formalin (mixture of 10 pbv of 37% formalin with 90 pbv water) and stored for at least 6 months before use. After six months, each brain was washed in tap-water overnight and sectioned coronally using a deli slicer. Slices measuring 10 mm in thickness were produced which were then plastinated using the standard S10/S3 silicone method. The plastinated brain slices were then used in conjunction with MRI images to analyze students’ preferences in neuroanatomy teaching.
Results: Our method first aims to understand the tradeoff preferences of the educators and the students between multiple teaching methods. These preferences and tradeoff information can be incorporated into a learning utility function - that brings a wealth of tools from decision analysis - to analyze the proper allocation of teaching time between different methods. The synergistic effect of using multiple teaching tools in anatomy classes is, therefore, formally quantified. Conclusions: Using the example of MRI and plastinated specimens in neuroanatomy, we showed how one can analyze tradeoff between two modalities. In other words, one can determine how many hours of one modality can be traded off for another to have the same learning utility. One can also deduce the best allocation of a fixed total number of hours to maximize learning utility.
Neuroanatomy, learning, utility analysis, MRI, plastination, brain.
Vijitashwa Pandey, PhD, Department of Industrial and Systems Engineering, Address: 2200 N. Squirrel Road, Rochester MI 48309, Phone: (248) 370-4044, Fax: (248)-370-4625, Email: pandey2@oakland.edu

![]()


Neuroanatomy is an essential course for healthcare professional students that aim to impart knowledge regarding the structure and development of the human nervous system (Mateen and D'Eon, 2008). Alongside diagnostic imaging (DI), current medical neuroanatomy curricula utilize two-dimensional cross-sections of the central nervous system to teach anatomy (Nolte and Angevine, 2007). Students must integrate these two dimensional images into a mental image, in order to grasp the spatial relationships of neuroanatomical structures within three dimensions. Due to time constraints and the extent of knowledge required, students find the task of visualizing three dimensional structures from two dimensional cross sections arduous. The complexity of the nervous system, including spatial overlap of substructures, exacerbates this issue. Emphasis is placed on the interpretation of diagnostic images, which serves as another challenge for students to master in a short period of time.
A recent study by Lujan and DiCarlo (2006) demonstrated that pre-clinical students prefer multiple styles (modalities) for learning and conceptualizing anatomy. As a result, anatomy courses are constantly supplemented with newer educational tools, including plastinated specimens and diagnostic imaging, with varying degrees of success. Plastination, a process created by Gunther von Hagens in 1977, confers durability to organs, which, in contrast to models, are anatomically correct and non-toxic (Fig. 1) (Bickley et al., 1981).
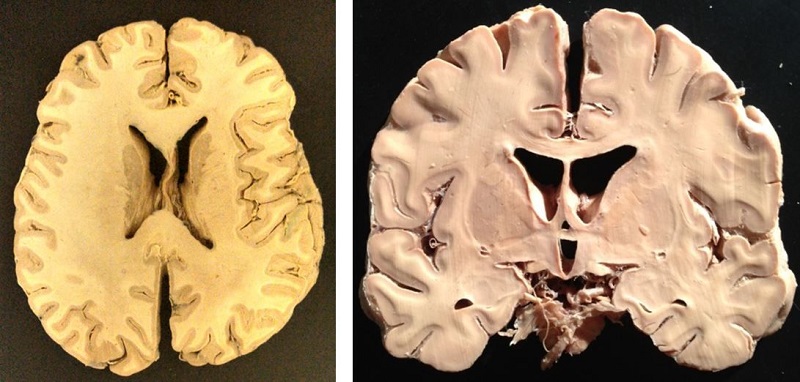
Figure 1 - Plastinated axial and coronal cross-sections of the human brain.
A recent study by Hoffman et al. (2010) has shown that the use of plastinated specimens as a sole learning tool for anatomy even produces similar results to traditional cadaveric dissection. As a result, there has been increased utilization of plastinated specimens as an aid to teach anatomy.
Diagnostic imaging is another essential tool for bridging the gap between structural and functional clinical neuroanatomy. Medical students find the integration of diagnostic imaging, such as MRI, into anatomy of great importance towards gaining knowledge and preparing for various clinical disciplines (Machado et al., 2013). In particular, neural structures can be used to create a simulated three-dimensional image for the region of interest (Fig. 2). This facilitates crucial insight into isolated images of pathology, as well as the normal structure as a whole. It is a powerful and frequently used diagnostic tool, making it extremely important to understand in preclinical years.
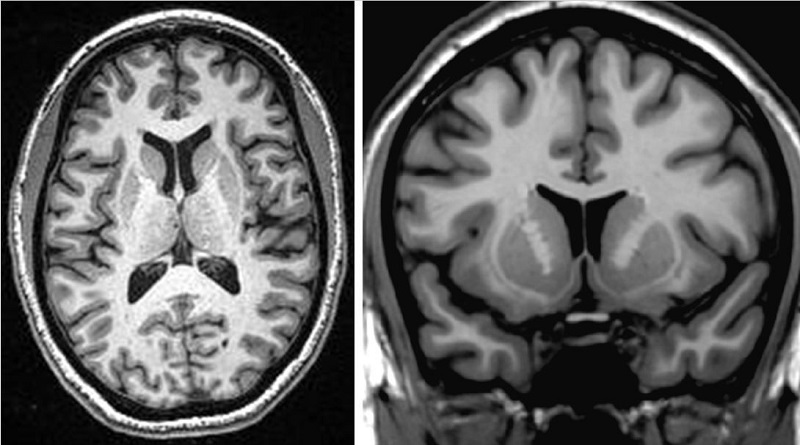
Figure 2 - MRIs of axial and coronal cross-sections of the human brain.
Although numerous tools exist to help students learn anatomy, some students are still fearful of the topic. This anxiety stems from the difficulty of neuroanatomy and the presence of numerous spatial orientations. The use of plastinated specimens can aid in combating this issue. The inability of students to conceptualize three-dimensional neuroanatomical structures from a two-dimensional image, such as an MRI, provides an added level of difficulty when studying neuroanatomy. Although neuroanatomical software helps to combat the challenges faced by healthcare professional students, it offers minimal aid to students with poor spatial skills (Levinson et al., 2007). Plastinated specimens have the potential to circumvent this limitation of neuroanatomical software. In a typical curriculum, where time and resources are limited, no study has as yet provided insights into finding the optimal combination of the two methods.
In this paper, the practicable knowledge provided to the students is termed learning utility, measured quantitatively by a utility function. A utility function is a representation of the preferences of the decision maker, defined as the educator, in a mathematical form. It assigns a numerical value to the outcomes, thus measuring their desirability. Normative[1] decision analysis indicates that a rational decision maker maximizes the expectation of this function when making uncertain decisions. A utility function is scaled between 0 and 1, where 0 corresponds to the least acceptable outcome and 1 corresponds to the best possible outcome. A utility function can also be used in the presence of uncertainty, i.e. it correctly ranks uncertain alternatives. The framework, therefore, departs from the ad-hoc techniques prevalent in medical education, by using normative utility analysis. In this paper, we focus primarily on MRIs and plastinated specimens, however the methodology proposed is general enough to be applied to other scenarios where the efficacy of multiple teaching tools is to be evaluated. The purpose of this study is to create a mathematical framework for analyzing and quantifying the learning utility from plastinated neuroanatomical specimens and diagnostic imaging.
|
|
[1] Decision Analysis (DA) is termed normative as it prescribes what a decision maker must do given his/her preferences. It is not a descriptive field in that it does not try to understand how people make decisions. The normativeness comes from DA being founded in mathematics.
Fixation:
Two brains, from female cadavers aged between 70-90 years of age, were removed from the body and then placed in a container of 10% formalin (mixture of 10 pbv of 37% formalin with 90 pbv water) and stored for at least 6 months before use. After six months, each brain was washed in tap water overnight and sectioned coronally using a deli slicer. Slices measuring 10 mm in thickness were produced.
Dehydration by Freeze Substitution:
Brain slices were dehydrated using the freeze substitution method (Schwab and von Hagens, 1981; Tiedmann and Ivic ,1988; Henry, 2005). Freeze substitution at -25° C in acetone is the recommended dehydration procedure for minimal shrinkage of tissue (Weber et al., 2007) and was utilized in this study. When purity of acetone above 99.5% was achieved, dehydration was considered complete and the specimens were transferred to silicone for impregnation.
Forced Impregnation:
Brain sections were transferred quickly from the acetone to the impregnation mixture and submersed in Silicone S10/S3, (Biodur Products, Heidelberg) overnight. A grid was used to keep the specimens submerged in the resin. The following morning the vacuum pump was turned on and the pressure in the vacuum chamber was slowly decreased. Each day of impregnation, pressure was decreased by 1/3 of the current pressure until the pressure reached 220 mm (9 in) of mercury.. The following day specimens were transferred to room temperature, removed from the silicone bath and left to drain the excess polymer.
Gas Curing/ Hardening:
Before curing, the specimens were blotted dry at room temperature. Specimens were exposed to S6 (Biodur Products, Heidelberg) vapor for three days, or until the curing process was completed.
Framework to measure interaction effects between MRI and Plastination
Although multiple teaching methods may improve the students’ learning utility understanding; an open question remains – what is the optimal combination? A general framework to quantify the combined utility from multiple learning methods is needed. Every decision maker has a tradeoff behavior between multiple attributes they are considering for a given decision situation. In our multiple teaching modalities example, tradeoff behavior refers to how many hours of one modality the educator is willing to sacrifice for another (and vice versa), to keep the learning utility constant. For example, when a curriculum recommends 10 hours each of MRI and plastination modalities, an educator may be indifferent towards sacrificing one hour of MRI for two additional hours of plastination modality. Once this information is encoded in a utility function, the tradeoff decisions can be made relatively easily without constant input from the educator.
To determine the mathematical expression for the overall learning utility function, initial individual learning utility curves which correspond to each modality must be identified. Learning utility derived from MRI and that from plastinated specimens is an increasing function of time spent doing each.
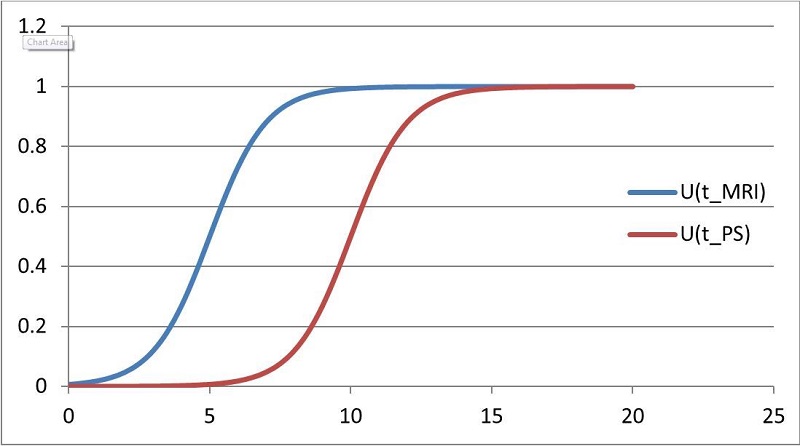
Figure 3 - Typical learning curves which can be divided into three sections, slow initial rate of learning, exponential growth and then leveling off, as a function of time.
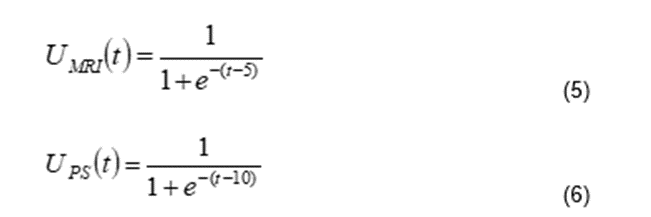
We utilize S-curves (Fig. 3) - a typical learning curve used in literature. These functions can be normalized between zero and one, where zero signifies no learning utility to the student while one signifies the maximum possible learning utility. An S-curve exhibits a slow initial phase, an exponential growth in learning as a function of time, followed by a leveling off of the curve, as tmax is reached. Notice that tmax can be (and generally would be) different for the two modalities. If the curve levels off for one modality (e.g. MRI training) at a certain time it signifies achievement of maximum benefit from that methodology. The use of another modality, e.g. plastinated specimens, is necessary for increased learning and achievement. Of course, other functions are possible such as exponential, linear or even stepwise functions. Logistic function provides the advantage that it can succinctly incorporate learning phases in a single closed-form expression.
For our two modalities example, we denote these curves by: U MRI (t) and UPS (t). To obtain overall learning utility we utilize the multi-linear form (Pandey, 2013).
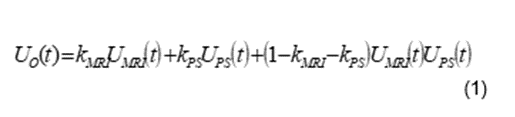
The scaling constants and lie between 0 and 1 and show the relative disinclination of the educator to trade off one attribute for the other. For example if = 0.7 and = 0.4, the educator is much less likely to sacrifice hours of studying MRIs compared to plastinated specimens. Furthermore, using the equation, one could even evaluate how many hours of one attribute can be traded off for another to achieve equivalent overall utility. Since the total curriculum hours are limited, the equation can be used to determine the optimal distribution of time (t) studying MRIs and plastinated specimens.
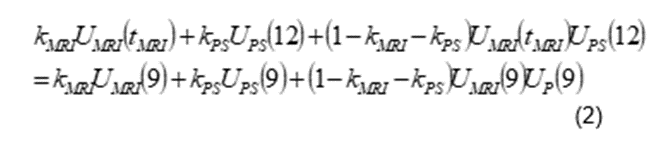
A closed-form expression for learning utility is identified by determining the value of the scaling constants using the following procedure. The educator is asked for the indifference points between different combinations of modalities through student surveys. For example, one could ask how many hours of MRI (tMRI) coupled with twelve hours of plastinated specimens is equivalent to nine hours each of MRI and plastinated specimens, as shown below. When the respondents provide tMRI, the following equation has two unknowns. As a result, two responses with different values of time are enough to derive the value of the scaling constants. Of course, one can ask multiple questions like this, which can help get a better idea of the value of the scaling constants:
A simple example
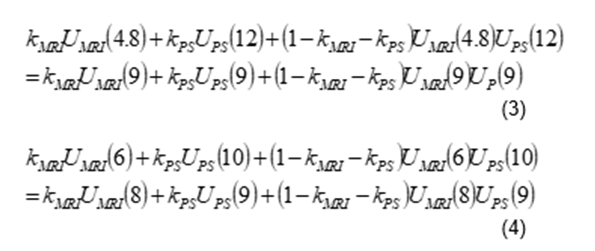
In order to assess the scaling constants, assume that the responses are as shown below in Table 1.
Table 1: Hypothetical responses to be used to get the scaling constants of the utility function. The subject is asked what value of the missing entry will make them indifferent between options 1 and 2.
| Option 1 | Option 2 | RESPONSE | |||
| tMRI | tPS | tMRI | tPS | ||
| ? hrs | 12 hrs | = | 9 hrs | 9 hrs | 4.8 hrs |
| 6 hrs | 10 hrs | = | 8 hrs | ? hrs | 9 hrs |
To find the scaling constants we solve the following equations simultaneously:
The functional forms of the two utility functions as shown in (Fig. 1) are:
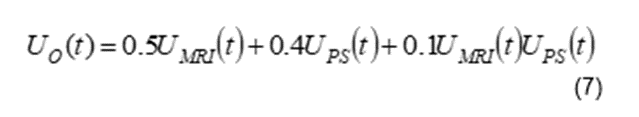
Since , KMRI + KPS < 1 , the two teaching methods are complements, i.e. they provide more learning utility together than the sum of their individual utilities. A sum greater than one would have implied that they are substitutes i.e., there would be a substantial overlap in their contributions to the learning utility. We now look at an isopreference curve (Fig. 4) corresponding to the learning utility function in Equation 7.
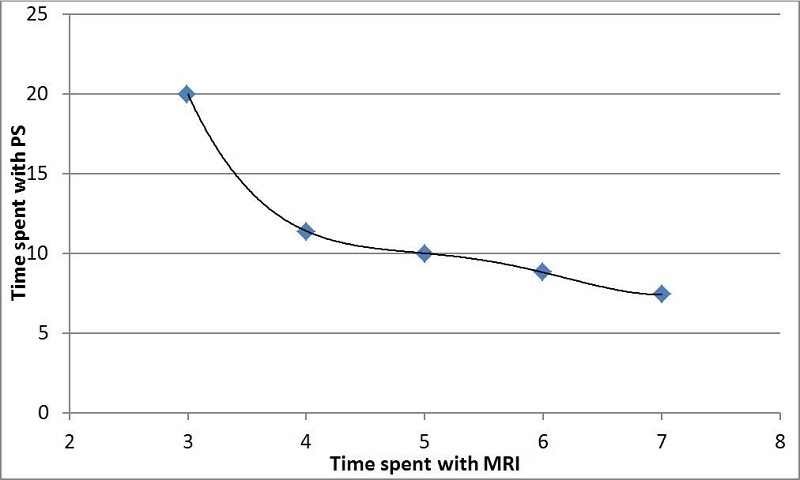
Figure 4 - Isopreference curve for the overall learning utility. The curve can be used to do tradeoff analysis between two methods of learning.
An isopreference curve is such that a decision maker is indifferent between the points on the curve i.e. as one moves along the curve one attribute improves while the other worsens just enough so that the net effect is cancelled. Using this curve, one can make tradeoff decisions as to how many hours of a modality can be substituted for another without having any effect on the overall learning utility. For example, one can see from the curve that 4 hours of MRI coupled with 11.4 with plastinated specimens has the same learning utility as that of 7 and 7.4 hours respectively. In other words, if MRI time is increased by 3 hours, one could reduce the time spent studying plastinated specimens by 4 hours.
One can also determine the optimal allocation of a fixed number of study hours using the method described above. In this case, we will maximize the overall utility under the constraint of fixed number of hours. For example, if the number of hours is fixed at 20 hours, the optimal division is 7.6 hours for MRI and 12.4 hours for plastinated specimens. Similarly, for a given learning level, one could find the minimum total number of hours required and the division between the two methods.
The use of anatomical teaching tools or modalities, including plastinated specimens and diagnostic imaging, aids in teaching students structural and clinical neuroanatomy. This article discussed the synergistic effect of using multiple teaching tools in anatomy classes and presented a method to formally quantify it. Many researchers have shown that students’ learning increases dramatically when many different modalities are used in conjunction. Neuroanatomy can be augmented by diagnostic imaging, just as MRI is used extensively to complement cadaveric dissection. Recently, plastinated specimens are also being used to give students a better understanding of three-dimensional structures. This immediately raises the question of how much time should be spent doing each. This paper provided a methodology for addressing this issue by using utility analysis.
Our method first tries to understand the tradeoff between multiple teaching modalities. These modalities can be combined using a learning utility function, which provides a wealth of tools, to analyze the proper allocation of teaching time. The educators and students can be asked for their preferences, which are then incorporated into a learning utility function. Using the example of MRI and plastinated specimens in neuroanatomy, we showed how one can analyze tradeoff between two modalities. In other words, one can determine how many hours of one modality can be traded off for another to have the same learning utility. One can also deduce the best allocation of a fixed total number of hours to maximize learning utility.
Normative utility theory is founded in mathematics and the recommendations made by the proposed model will best represent the educator and students’ preferences. Although the approach presented demonstrates how preferences can be modeled and incorporated into a classroom, subsequent research will aim to validate the approach utilized. Further research will consist of survey data demonstrating the synergistic effects of using plastinated specimens for teaching diagnostic imaging. This will provide a formal way of allocating teaching resources to maximize learning utility.
Acknowledgements
The authors would like to thank Dr. John Wall for help with procuring the MRI images used in this paper.
Bickley HC, von Hagens G, Townsend FM. 1981: An improved method for preserving of teaching specimens. Arch Pathol Lab Med 105:674-676.
Henry RW. 2005: Silicone impregnation and curing. Abstract presented at The 8th Interim Conference on Plastination- Lake Ohrid, Macedonia, July 5-11, 2005. J Int Soc Plastination 20:36-37.
Hoffmann D, May N, Thomsen, T, Holec M, Andersen, K, Pizzimenti M. 2010: Medical students using plastinated prosections as a sole learning tool perform equally well on identification exams as compared to those performing dissections over the same regions. FASEB Journal 24:176.5.
https://doi.org/10.1096/fasebj.24.1_supplement.176.5
Levinson AJ, Weaver B, Garside S, McGinn H, Norman GR. 2007: Virtual reality and brain anatomy: a randomized trial of e-learning instructional designs. Med Educ 41:495-501.
https://doi.org/10.1111/j.1365-2929.2006.02694.x
Lujan HL, DiCarlo SE. 2006: First-year medical students prefer multiple learning styles. Adv Physiol Educ 30:13-16.
https://doi.org/10.1152/advan.00045.2005
Machado JA, Barbosa JM, Ferreira MA. 2013: Student perspectives of imaging anatomy in undergraduate medical education. Anat Sci Educ 6:163-169.
https://doi.org/10.1002/ase.1331
Mateen, FJ, D'Eon MF. 2008: Neuroanatomy: a single institution study of knowledge loss. Med Teach 30:537-539.
https://doi.org/10.1080/01421590802064880
Nolte J, Angevine, JB Jr. 2007: The Human Brain in Photographs and Diagrams. 3rd ed. St. Louis, MO: Mosby, Inc. p. 272.
Pandey V. 2013: Decision based design. Taylor and Francis, Boca Raton, FL USA, pp. 41-106.
Schwab K, von Hagens G. 1981: Freeze substitution of macroscopic specimens for plastination. Acta Anat 111: 139-140.
Tiedemann K, Ivic-Matijas D. 1988: Dehydration of macroscopic specimens by freeze substitution in acetone. J Int Soc Plastination 2:2-12.
https://doi.org/10.56507/SCLL2742
Weber W, Latorre R, Henry RW. 2007: Polyester plastination of biological tissue: P35 technique. J Int Soc Plastination 22: 50-58.
https://doi.org/10.56507/MFED4472