Plastination Laboratory, Institute of Anatomy, Vienna University, Währingerstrasse, 13/ 3 A-1090 Vienna, Austria.
The goal of this project was to determine the amount of shrinkage that occurs during E12 plastination. A human pelvis was transversely sliced into 3.5mm sections and processed using the standard El2 plastination process. After initial slicing and after three of the processing steps (both acetone baths and curing), the area of each slice was traced and recorded using IMAGE TOOL v.2.0 software. The total shrinkage percentage was calculated for the entire process, as was percent shrinkage between each recorded measurement. Total shrinkage (decrease in area) was 6.65%. The greatest shrinkage (4.52%) occurred between the final acetone bath and curing.
human pelvis slices; polymer E12; shrinkage
M.C. SORA: Telephone: 43-1-4277-611-50; Fax: 43-1-4277-611-70;
E-mail: mircea- constantin.sora@univie.ac.at

![]()


The E12 plastination process is a well-established preservation technique used for demonstration in teaching and also in research (von Hagens et al., 1987). In spite of that, we found no data concerning the shrinkage of plastinated slices. Knowing that shrinkage may lead to incorrect conclusions in morphometric or topographic questions, this study was designed to determine the shrinkage of slices using the El2 plastination technique. These data may partially fill the lack of information about shrinkage in plastination. This is part of a greater project on shrinkage in plastination that started with a study on P40 shrinkage (Sora et al., 1999). A previous publication using plastination in 3D reconstruction (Sha et al., 2001), did not address shrinkage. Slice shrinkage after E12 plastination should be taken into account when reconstruction of structures is intended.
Material and slicing:
A male human pelvis was removed from an unfixed cadaver and then frozen at -80°C for one week. Transverse slices (3.5mm) were cut, starting at the level of the first sacral vertebrae and finishing just distal to the minor trochanter. Thirteen slices were used for this study. Numbering markers were placed on the superior surface. The slices were stored at -25°C overnight prior to processing for E12 plastination.
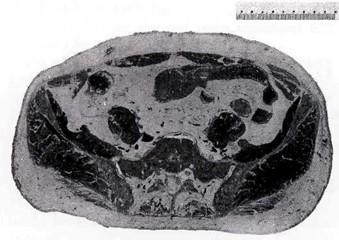
Figure 1. Frozen cross-section of human pelvis.
Scanning:
The original size of the frozen slices (Fig. 1) was recorded by scanning their superior aspect via an EPSON GT-10000+ Color Image Scanner. A cm scale served as a calibration marker. The slices were scanned three more times: Twice on cold acetone saturated slices (after the first and last acetone bathes) and Once on the dry final cast slice (after El2 plastination) (Table 1). The slices, including the fresh-frozen, were covered by a transparent foil on both sides to protect the scanner and to decrease acetone vaporization. Using the UTHSCSA MAGE TOOL v.2.0 for Windows software (The University of Texas Health Science Center in San Antonio), the area of the slices was calculated.
Dehydration and degreasing:
Twenty-five liters of cold (-25°C) technical quality acetone was used for each dehydration bath for the 13slices. Each slice was placed between plastic grids to allow better circulation of the dehydration fluid. Dehydration time was 7 days. Acetone was changed on day 4 and day 7 using cold technical quality acetone. When dehydration was complete, the freezer was disconnected to warm to ambience (15°C) overnight. On day 8, acetone was replaced with room temperature methylene-chloride (MeCl) for 7 days of degreasing (Table 1).
| Temperature | Measurements | Days | ||
| Fresh | -80°C | yes | 0 | |
| Acetone 1 | -25°C (96%) | yes | 4 | |
| Acetone 2 | -25°C (99%) | yes | 3 | |
| MeCl | 15°C | no | 7 | |
| Impregnation | 5°C | no | 2 | |
| After E12 | 15/45°C | yes | 6 | |
Impregnation:
Impregnation was performed at 5°C using the classic epoxy (E12) reaction-mixture: E12/E1/AE10 (95:26:10 pbw) (von Hagens, 1985). The slices were removed from the methylene chloride bath, submerged in the El2 reaction-mixture and placed in a vacuum chamber. Pressure was continuously reduced over the next two days to 2mm Hg. Temperature was kept under surveillance in order to avoid El2 crystal formation which will take place if the temperature decreases below 0°C.
Casting and curing:
The slices were cast between two sheets of tempered glass and a flexible gasket was used as a spacer (4mm). The following E12 reaction-mixture was used for casting: E12/E1/AE30 (95:26:5). The slices were placed between glass plates and sealed. The flat-chambers were filled with casting-mixture and placed in a vacuum chamber at 3mm Hg for one hour to remove small air bubbles present in the resin. Large bubbles were removed afterwards manually. After bubble removal, the flat-chambers were placed horizontally inclined at 15° and left until the next day. The polymer became more viscous and sticky. The next day the flat-chambers containing the slices were placed in a 45 °C oven for 4 days. After removal of the flat-chambers from the oven and cooling to room temperature, the glass plates were removed carefully and the sheets were cut as desired.
The plastinated E12 slices obtained were of high quality (Figs. 2, 3). Their transparency and color were perfect and shrinkage was not evident. Average tissue loss between sections was 1 mm due to the saw blade. The finished E12 slices were semi-transparent, easy to orient and offered a lot of anatomical detail down to the submacroscopic level. The transparent loose areolar and adipose tissue contrasted perfectly with the muscle and epithelial tissue.
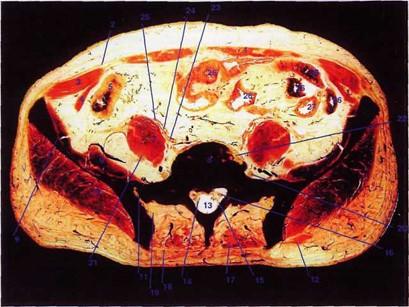 Figure 2. E12 Plastinated human pelvis section. 1. M. rectus abdominis, 2. Externusaponeurose, 3. M. obliquus internus abdominis, 4. M. transversus abdominis, 5. Caecum, 6. M. iliacus, 7. M. psoas major, 8. Promontorium/ Os sacrum, 9. Os ilium/Fossa iliaca, 10. M. gluteus medius, 11. Articulatio sacroiliaca, 12. M. gluteus maximus, 13. Canalis sacralis, 14. Cauda equina, 15. Dura mater spinalis, 16. N. spinalis(sacralis 1), 17. M. erector spinae, 18. Fascia thoracolumbalis, 19. Ligg. sacroiliaca posteriora, 20. Truncus lumbosacralis, 21. N. femoralis, 22. Lig. longitudinale anterius, 23. A. iliaca interna, 24. A. iliaca externa, 25. Ureter dexter, 26. Ileum, 27. Colon descendens. |
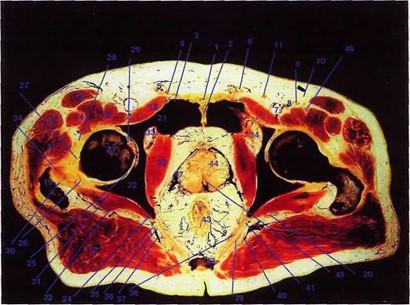 Figure 3. E12 Plastinated human pelvis section. 1. Externusaponeurosefasern, 2. Symphysis pubica, 3. Tuberculum pubicum, |
The average total percent shrinkage after El2 plastination per slice was 6.65% (+/- 1.123 standard deviation) (Table 2). Average shrinkage after the first acetone bath was 1.33%. Average shrinkage during the second acetone bath (prior to warming to room temperature) was 0.8%. Average shrinkage per slice during MeCl and the epoxy process was 4.52%. The acetone percentage at the end of acetone bath one was 96%. The acetone percentage at the end of acetone bath two was 99%.
| NR. | Fresh | 96% Acetone |
99% Acetone |
After E12 |
| 35a | 61612.36 | 61235.11 | 60546.46 | 57946.42 |
| 36a | 61741.68 | 61167.09 | 60778.50 | 56627.71 |
| 37a | 63263.41 | 62241.22 | 62055.07 | 57639.29 |
| 38a | 63483.53 | 62017.89 | 61286.99 | 60182.38 |
| 39a | 63669.02 | 62567.11 | 62249.21 | 59282.22 |
| 40a | 64292.74 | 63455.28 | 63058.32 | 59663.66 |
| 41a | 63746.73 | 63112.97 | 62337.92 | 60253.40 |
| 42a | 63837.84 | 63075.22 | 61948.24 | 59701.14 |
| 43a | 64801.36 | 64521.07 | 64347.75 | 60861.43 |
| 44a | 64767.05 | 63687.45 | 63322.74 | 60233.35 |
| 45a | 65120.47 | 64034.88 | 63551.06 | 61252.31 |
| 46a | 64929.94 | 64012.37 | 63319.67 | 60527.69 |
| 47a | 64667.38 | 63787.56 | 63438.67 | 60916.67 |
| Average Shrinkage = | 1.33 +/- 0.502% | 2.13 +/- 0.668% | 6.65+7-1.123% | |
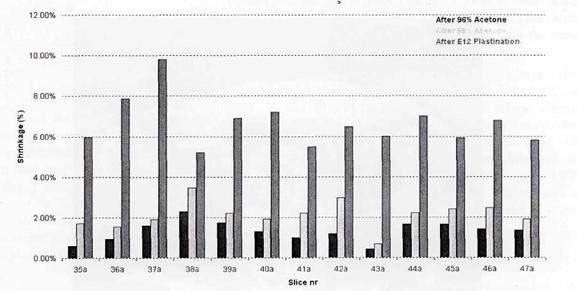
Figure 4. Percent shrinkage of tissue slices at different stages of E12 plastination.
Since the beginning of plastination, the El2 technique is the elected method for producing transparent body slices. Transparent body or organ slices are used for teaching and research purposes, because they allow the study of the topography of all body structures in a non-collapsed and non-dislocated state. In addition, the specimens are useful in advanced training programs in sectional topography (resident training in computed tomography and magnetic resonance imaging). Many research studies deal with the topography of anatomical structures. However, if distances between structures or calibers of vessels are to be measured on plastinated slices, correct results can only be obtained when the shrinkage rate is considered. However, we did not find any data regarding the shrinkage of E12 slices in the literature.
Two factors contribute to the amount of global shrinkage: Shrinkage of the epoxy polymer itself and Shrinkage of the body slices during the entire plastination process. Because no data was found on the shrinkage rate of BIODUR E12, we designed and carried out experiments with E12 polymer by casting 4mm flat-chambers without inserting body slices. The observed shrinkage of E12 polymer was less than 0.2%. These results are comparable to data obtained from the CIBA Company (Ciba Spezialtatenchemie GmBH, Breitenfurterstrasse 251, A-1231, Vienna, Austria) who use similar epoxy resins.
The shrinkage values in this study represent only two-dimensional shrinkage. Determination of shrinkage in the third (vertical) direction would have been very difficult, and almost impossible to make after each plastination step. The thickness of the plastinated slices was defined by the gasket (4mm) used for construction of the flat-chambers. Only by transecting the slices and scanning the edge, would it be possible to obtain information on vertical shrinkage. We did not perform this step.
The superior surface of each slice was used to measure the area. By evaluating the obtained data we were able to determine the total shrinkage of the area of each slice. As well data was obtained from three stages throughout the process. Although the slices were removed from acetone for scanning, it is improbable that this led to shrinkage, because the slices were covered with foil to decrease acetone vaporization. Also, scanning took only one minute.
It is essential to be aware of the global shrinkage percent, due to plastination, when dealing with measurements. When considering the plastination process, an average shrinkage value of 6.65% seems reasonable. The percent of shrinkage during the first cold acetone bath was very low (1.33%). Shrinkage in the second cold acetone bath was only 0.8%. Hence the total shrinkage during cold acetone dehydration was 2.13%. This low value could be expected when one considers the principals of freeze substitution (von Hagens, 1985). Shrinkage during the period of room temperature acetone and methylene chloride and during the E12 process was 4.52% and might also be considered satisfactory. This value represents the shrinkage that occurs during the transition from -25°C acetone to room temperature acetone, during degreasing in methylene chloride at room temperature, during epoxy impregnation and finally during curing. It would have been valuable to have measured the shrinkage after the methylene chloride bath. However, methylene chloride is very aggressive and the slices were not measured at this stage in order not to risk ruining the scanner. By comparing the data for each slice (Table 2, Fig. 4) it is evident that some slices shrunk more than others. A possible explanation could be that these slices contained more lipid tissue than others. The shrinkage bars given in figure 4 reveal that shrinkage curves for Acetone 1 and Acetone 2 are similar, whereas the curve after E12 plastination shows some deviations.
By comparing the shrinkage rates occurring after different steps of the plastination process, it may allow us to make suggestions about the processing temperature. It is known that dehydrating tissue at lower temperatures (-25° to +5°C) will keep shrinkage lower (von Hagens, 1985). Shrinkage may have been reduced if the temperature of the final acetone and methylene- chloride bath would have been 5°C or lower. However, lower temperature may increase the risk of getting less transparent slices because of insufficient removal of the tissue lipids (Cook and Al-Ali, 1997) unless the length of degreasing time is substantially increased.
When plastinated slices are used for morphometric studies, the shrinkage of each slice should be assessed in order to obtain accurate results. The total shrinkage determined in the present study should be useful to help estimate the shrinkage during E12 plastination, but other body regions (such as the thigh - essentially only bone and muscle or the distal antebrachium - more bone than muscle as opposed to the thigh) should also be studied to see if tissue type alters shrinkage. Our goal is to extend our study to determine specific tissue shrinkage: i.e. connective tissue, muscle tissue and nervous tissue.
Cook P, Al-Ali S. 1997: Submacroscopic interpretation of human sectional anatomy using plastinated E12 sections. J Int Soc Plastination 12(2): 17-27.
https://doi.org/10.56507/XICY2283
Sha Y, Zhang SX, Liu ZJ, Tan LW, Wu XY, Wan YS, Deng JH, Tang ZS. 2001: Computerized 3D- reconstructions of the ligaments of the lateral aspect of ankle and subtalar joints. Surg Radiol Anat 23(2): 111-114.
https://doi.org/10.1007/s00276-001-0111-1
Sora M-C, Brugger P, Traxler H. 1999: P40 plastination of brain slices: Comparison between different immersion and impregnation conditions. J hit Soc Plastination 14(l):22-25.
https://doi.org/10.56507/XLSJ5724
von Hagens G. 1985: Heidelberg Plastination Folder: Collection of all technical leaflets for plastination. Heidelberg, Germany: Anatomisches Institut I, Universitat Heidelberg.
von Hagens G, Tiedemann K, Kriz W. 1987: The current potential of plastination. Anat Embryology 175(4):411-421.
https://doi.org/10.1007/BF00309677