1 Department of Anatomy and Structural Biology, University of Otago, New Zealand.
2 Section of Surgery, Department of Medical & Surgical Sciences, University of Otago, New Zealand.
E12 sheet plastination has been used as a teaching aid for several years. More recently, El2 sheet plastinated tissues have been used as a research tool in a variety of areas. This paper describes a new procedure of viewing E12 sheet plastinated material. Skin and subcutaneous tissue from four formalin-fixed cadavers was used in this investigation. The blood vessels of the tissues were perfusion stained with diluted Gill's hematoxylin #1. The tissues were then processed for E12 sheet plastination. Light microscopy and confocal laser scanning microscopy were used to view the E12 plastinated specimens. It was found that autofluorescence was dominant within this tissue at 488nm excitation. Due to the emission spectrum and the spatial distribution of the autofluorescence, this autofluorescence is likely to be due to the connective tissue - in particular, the collagen. The results of this study indicate that, using serial optical sections, the confocal laser scanning microscope provides a much higher resolution image, and reveals structures that are virtually invisible by light microscopy.
E12 sheet plastination; autofluorescence; collagen; connective tissue
M. ZHANG: Department of Anatomy and Structural Biology, University of Otago, P.O. Box 913, Dunedin 9001, New Zealand; Telephone: 64-3-479-7378; Fax: 64-3-479-7254; E-mail: zhang.ming@stonebow.otago.ac.nz

![]()


Over two decades ago the technique of plastination was developed by Gunther von Hagens, in Heidelberg, Germany (von Hagens, 1979). Plastination involves substituting the tissue water in a specimen with polymer. The polymer is subsequently cured to form a dry, firm, flexible, and durable specimen. One of the more recent forms of plastination is E12 sheet plastination (Weber and Henry, 1993). Since its development in the mid-1980's El2 sheet plastination has generally been used only for teaching because of its strong correlation with both CT and MR-images. More recently, El2 sheet plastination has been used as a research tool and is now becoming an integral part of a wide range of anatomical research, especially at the macro-micro level (An and Zhang, 1999; Johnson al., 2000a; Johnson et al., 2000b; Phillips et al., 2000; Zhang and An, 2000). E12 sheet plastination has been used extensively by our group for a variety of research projects (An and Zhang, 1999; Johnson et al., 2000a; Johnson, et al., 2000b; Phillips et al., 2000; Zhang and An, 2000). E12 plastinated slices are conventionally viewed with either no magnification or with low magnification under a dissection microscope. However, some structures are not able to be effectively viewed by this method, especially when the structures of interest are relatively small and the natural colors and contrasts of the surrounding tissue obscures the region of interest, conventionally confocal laser scanning microscopy (CLSM) relies on a fluorochrome to produce the
fluorescent image of a specific structure, which is detected electronically. However, some tissue types (e.g. connective tissue) and chemicals (e.g. aldehydes) are autofluorescent, and thus, do not require a fluorochrome. Autofluorescence may be from a number of sources. Several elements of normal tissue, such as collagen, are known to be auto-fluorescent at specific wavelengths (Koenig and Schneckburger, 1994). Tissue autofluorescence has been used for a wide range of applications - from basic science research (Swatland, 1988; Kollias et al., 1998), to clinical diagnostics (Koenig and Schneckburger, 1994; Glassman et al., 1995; Banerjee et al., 1998). Auto-fluorescence may also be due to chemicals used in the fixation during the tissue preparation. This has been shown to be true in the case of fixatives such as formalin, and its derivative, formaldehyde (Clancy and Cauller, 1998; Aisa et al., 2001).
This paper describes the procedure of viewing E12 sheet plastinated material with CLSM and outlines the possible benefits and limitations of such a technique.
Four lower limbs from four cadavers were prepared for this investigation (two female, two males; 65-87 years). The arterial and venous systems of the cadavers were thoroughly flushed via the right femoral artery with normal saline via a gravity feed system, at 1.5m elevation, until the efflux from the femoral vein was clear. This was followed by 20 liters of 10% neutral buffered formalin to fix the tissue. The limbs were then removed from the cadavers and the vascular system of the lower limbs was then stained using dilute Gill's hematoxylin #1 (diluted 1:1 in distilled water) via the femoral artery for five minutes, and then rinsed with 10 liters of tap water. This protocol of staining the blood vessels with Gill's hematoxylin #1 has allowed identification of blood vessels from the large arteries, through the capillaries, to the venous system. Being able to detect these blood vessels has been very useful in identifying the spatial distribution of the autofluorescence. Skin flaps (70mm x 120mm), including skin, subcutaneous tissue and deep fascia, were removed and embedded in 20% gelatin. The gelatin blocks were deep frozen to -85°C for 24 hours. The gelatin block was oriented so that the tissue was is the sagittal plane and frozen 2.5mm sections were then cut using a band saw. The gelatin was not removed from the tissue as it assisted with tissue orientation. The plastination protocol was used as previously described by An and Zhang (1999). Briefly, the tissue sections were then put through an ascending series of acetone (94-100%) at -20°C until the tissue was completely dehydrated (approximately four weeks). Following dehydration, the acetone and tissue sections were removed from the freezer and warmed to 25 °C for approximately two weeks to aid with the degreasing process. The acetone was not changed during the degreasing process. The tissue slices were then impregnated with an epoxy reaction-mixture (E12/E1/AE10/AE30 at a ratio of 100:28:20:5 (parts by weight); Biodur, Rathausstrasse 18, 69126, Heidelberg, Germany) in a vacuum chamber at 0°C. Resin impregnated slices were laid flat, covered with epoxy reaction-mixture and cured between 250µm amorphous plastic sheets in a 37°C oven.
The El2 plastinated slices were viewed using light microscopy (LM) and CLSM (BioRad). The slices were systematically viewed in entirety by 0.5-1.5µm thick optical sections at both 488nm and 568nm excitation. Digital overlay images were collected from exactly the same point in both the LM and CLSM images by the BioRad CLSM system (including 2-dimension images and 3-dimensional reconstructions). This allowed judgment to be made on the spatial localization of the fluorescence within the tissue.
E12 sheet plastinated tissue is fluorescent
The E12 sheet plastinated material we examined was formalin fixed, with the vascular structures stained by hematoxylin perfusion. After these pre-treatments autofluorescence was found to be present within the tissue at both 488nm and 568nm excitation wavelengths (Fig. 1A-D). The 488nm excitation gave a much stronger emission signal from the tissue.
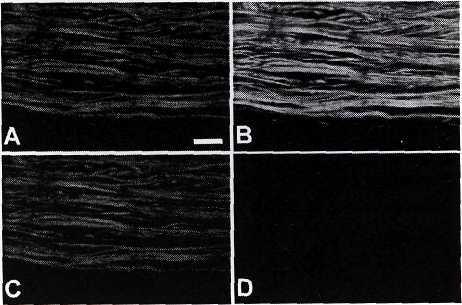
Figure 1. Shown are the emission images from the E12 sheet plastinated tissue when viewed by either 488nm or 568nm excitation wavelengths. 'Channel V is the channel at which the image from the 568nm emission is detected, while 'Channel 2' is the channel at which the image from the 488nm emission is detected. It would normally be expected that there should only be fluorescence detected at 488nm excitation/Channel 2 (B), or, 568nm excitation/Channel 1 (C). Here we can see that there is also fluorescence present at the 488nm excitation/Channel 1 (A). This is due to the long excitation 'tail' on the 488nm peak, which is partially extending into the 568nm wavelengths. For this purposes of this investigation the 488nm excitation was used, and detected on channel 2, due to the fact that this arrangement gives the strongest autofluorescence signal from this tissue. Scale bar = 200microm.
Visualization of previously unseen structures by CLSM ofE12 specimens
CLSM of the E12 tissue highlighted the collagen distribution and arrangement in loose connective tissue surrounding adipocytes (Fig. 2), epineurium surrounding small cutaneous nerves (Fig. 2) and the structure of the deep fascia.
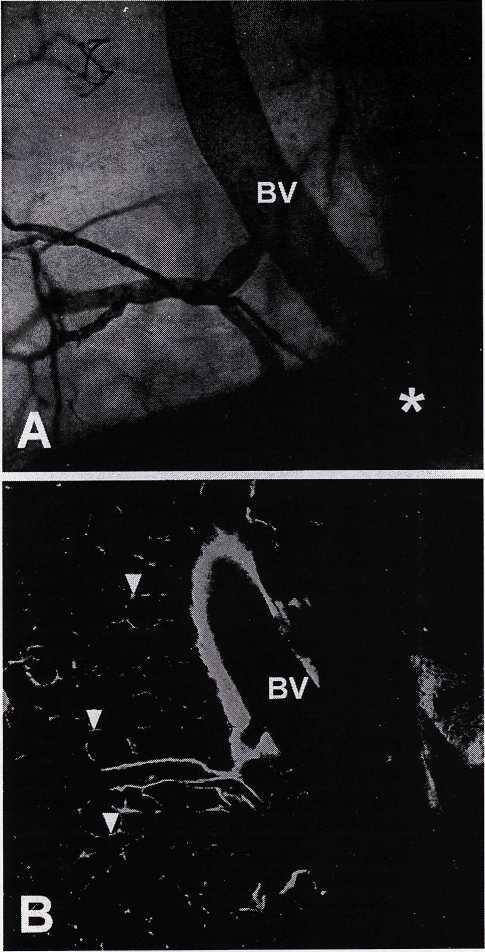 |
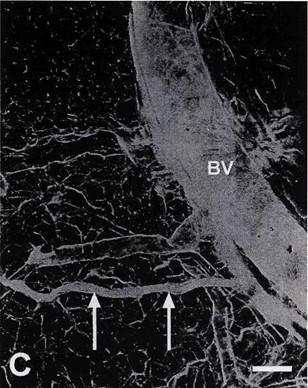 Figure 2. A. Light microscopy image of El2 plastinated tissue. The blood vessels (BV) are stained with dilute Gill's hematoxylin #1. Note the obscuring shadow left by a large out-of-focus vessel (asterisk). B. This is a 0.5-1.5microm thick image from the confocal laser scanning microscopy. The connective tissues surrounding the adipocytes are clearly visible (arrowheads), along with the blood vessel walls. C. This is a three-dimensional reconstruction of the confocal laser scanning microscopy images from 0.5micron thick optical sections through a total of 210 micron of tissue. Note the complex three-dimensional arrangement of the loose connective tissues surrounding the adipocytes. Arrows point to a small coetaneous nerve that was invisible in the LM image (A). Scale bar = 100 µm |
Both the 0.5-1.5µm thick optical sections, and the three-dimensional reconstructed images, from the CLSM allow research to be undertaken on structures within the El2 sheet plastinated material which would otherwise have not been visualized. The best example of such a structure is the arrangement of the collagen within connective tissue structures associated with various organs such as epineurium and loose connective tissue. These structures are virtually invisible in LM images of the corresponding E12 sheet plastinated specimens. Thus, CLSM provides a new perspective of viewing the E12 sheet plastinated tissues.
Tissue differentiation/definition
CLSM uses a physical pinhole to serially optically section tissue. Due to the fact that this is an optical section, no tissue is lost to cutting or preparation damage. The resolution of the CLSM is such that each optical section through the tissue is 0.5-1.5µm in thickness, thus giving a very high-resolution image that is virtually two-dimensional.
The serial optical sections obtained by CLSM are very well suited to be reconstructed into a three- dimensional image (Fig. 2). This reconstructed image allows direct comparison to be made between the LM image, which is an image of a three-dimensional structure, and the corresponding reconstructed CLSM image (Fig. 2).
Source of autofluorescence from the E12 sheet plastinated tissue
Due to this excitation wavelength, and the spatial distribution of the emitted fluorescence, it was indicated that the detected autofluorescence was likely to be derived from the connective tissue, in particular the endogenous fluorescence from collagen (Kollias et al., 1998; Banerjee et al., 1999). It has been shown that collagen from skin, cervical tissue, bone, ligament and colon is autofluorescent (Prentice, 1967; Leffell et al., 1988; Swatland, 1988; Glassman et al., 1995; Banerjee et al., 1998; Kollias et al., 1998; Banerjee et al., 1999). Many of these studies report that collagen is fluorescent at a much shorter wavelength. Kollias et al. (1998) demonstrated that a pepsin-digestible collagen was present at 340nm, and a collagenase-digestible collagen was present at 360nm. Following this, Banerjee et al. (1999) showed that collagen IV is identified by auto- fluorescence at the 365nm wavelength. This difference may be explained. It has been shown that ultraviolet (UV) light changes the auto-fluorescence peaks (Swatland, 1988; Kollias et al., 1998). Swatland (1988) found that exposing various bovine tissues to UV light for one minute altered the auto-fluorescent emission from 410-420nm to 450-470nm. Similarly, after 30min exposure to UV light, the emission peak at 450-470nm was not present, instead a peak was most intense at approximately 530nm. If we acknowledge that these E12 sheet plastinated specimens of human skin and subcutaneous tissue have been subjected to very low, but chronic levels of UV light for 65-87years then it seems possible that the auto-fluorescence peak is of a longer wavelength than those found in experiments on laboratory based animal models with relatively short life-spans.
Fixative derived fluorescence
It should also be acknowledged that CLSM does carry with it some inherent limitations. In this investigation all of the tissue studied had been fixed in 10% neutral buffered formalin. Literature indicates that formalin, and the similar chemical formaldehyde, have auto-fluorescent properties (Clancy and Cauller, 1998; Aisa et al., 2001). For this reason the type of fixative used in tissue preparation for E12 sheet plastination may be very important. It would be of great interest to investigate the effect that different fixation protocols, or no fixation, have on the auto-fluorescence of plastinated tissue. However, it is our policy that all human tissue for plastination must be fully fixed prior to plastination.
Limitations of CLSM and E12 sheet plastination
A limitation of CLSM of E12 sheet plastinated material is that the physical size of the specimen. In order to be able to view specimens under the BioRad confocal microscope the specimens must be no larger than approximately 100mm x 40mm. This means that large specimens used either for other research projects or teaching are not able to be investigated by CLSM. Generally specimens are required to be produced specifically for CLSM examination, although larger specimens may be 'cut-down' to a size which is able to be used for CLSM.
Another limitation of CLSM of E12 specimens is that the penetration of the light into the E12 specimens from the CLSM laser is relatively limited. Under optimal conditions the laser light may only penetrate 300µm into the specimen. This means that in a 2.5mm thick E12 sheet plastination specimen, a total of only 600µm (300µm from each side of the tissue), the remaining 1900µm of tissue thickness is not detected by the CLSM and may only be viewed by conventional LM. There is, however, a major benefit to the lack of penetration of the CLSM laser light into the tissue, the 600µm of tissue thickness that are visualized by CLSM have incredibly high definition and differentiation. Due to the fact that this very high definition image is only 0.5-1.0 micron in thickness, and with no 'missing sections' between adjacent optical sections, the series of optical sections can be reconstructed to form a high resolution image. This reconstructed image has one major benefit over either LM images (which are images of a three dimensional structure) or large 'whole mount' fluorescent images, due to the fact that the reconstructed CLSM images have no out-of-focus images or 'background noise'.
Acknowledgements: The authors wish to acknowledge the assistance of Mr. Andrew McNaughton, South Campus Electron Microscopy Unit, University of Otago, with the Confocal Laser Scanning Microscopy. The authors would also like to thank Mr. Brynley Crosado for his assistance with cadaver preparation.
This paper was presented, in part, at the 10th International Conference on Plastination, St. Etienne,
France, July 2000.
In conclusion, CLSM has been shown to be a highly effective tool for viewing the connective tissue, in particular collagen, within E12 sheet plastinated specimens. This method is likely to prove to be very useful as a research tool for the investigation of connective tissue architecture.
Aisa J, Lahoz M, Serrano P, Perez-Castejon M, Junquera C, Martinez-Ciriano M, Pes N, Vera-Gil A. 2001: Acetylcholinesterase positive and paraformaldehyde induced fluorescence positive innervation in the upper eyelid of the sheep (Ovis aries). Histol Histopathol 16:487-496.
An P-C, Zhang M. 1999: A technique for preserving the subarachnoid space and its contents in a natural state with different colours. J Int Soc Plastination 14:12- 17.
https://doi.org/10.56507/CQUW3856
Banerjee B, Miedema B, Chandrasekhar HR. 1998: Emission spectra of colonic tissue and endogenous fluorophores. Am J Med Sci 316:220-226.
https://doi.org/10.1097/00000441-199809000-00013
Banerjee B, Miedema BE, Chandrasekhar HR. 1999: Role of basement membrane collagen and elastin in the autofluorescence spectra of the colon. J Investig Med 47:326-332.
Clancy B, Cauller L. 1998: Reduction in background autofluorescence in brain sections following immersion in sodium borohydride. J Neurosci Methods 83:97-102.
https://doi.org/10.1016/S0165-0270(98)00066-1
Glassman W, Byam-Smith M, Garfield RE. 1995: Changes in rat cervical collagen during gestation and after antiprogesterone treatment as measured in vivo with light-induced autofluorescence. Am J Obstet Gynecol 173:1550-1556.
https://doi.org/10.1016/0002-9378(95)90648-7
Johnson G, Zhang M, Barnett R. 2000a: A comparison between epoxy resin slices and histology sections in the study of spinal connective tissue structure. J Int Soc Plastination 15:10-13.
https://doi.org/10.56507/CXGV7781
Johnson G, Zhang M, Jones D. 2000b: The fine connective tissue architecture of the human ligamentum nuchae. Spine 25:5-9.
https://doi.org/10.1097/00007632-200001010-00003
Koenig K, Schneckburger H. 1994: Laser-induced autofluorescence for medical diagnosis. J of Fluorescence 4:17-40. https://doi.org/10.1007/BF01876650
Kollias N, Gillies R, Moran M, Kochevar IE, Anderson RR. 1998: Endogenous skin fluorescence includes bands that may serve as quantitative markers of aging and photoaging. J Invest Dermatol 111:776-780.
https://doi.org/10.1046/j.1523-1747.1998.00377.x
Leffell DJ, Stetz ML, Milstone LM, Deckelbaum LI. 1988: In vivo fluorescence of human skin. A potential marker of photoaging. Arch Dermatol 124:1514- 1518.
https://doi.org/10.1001/archderm.124.10.1514
Phillips M, van Rij A, Zhang M. 2000: Valves are abundant in the small superficial veins of the human lower limb. Proceedings of the University of Otago Medical School 78:14.
Prentice AI. 1967: Autofluorescence of bone tissues. J Clin Pathol 20:717-719.
https://doi.org/10.1136/jcp.20.5.717
Swatland HJ. 1988: Autofluorescence of bovine ligamentum nuchae, cartilage, heart valve and lung measured by microscopy and fibre optics. Res Vet Sci 45:230-233.
https://doi.org/10.1016/S0034-5288(18)30937-8
von Hagens G. 1979: Impregnation of soft biological specimens with thermosetting resins and elastomers. AnatRec 194:247-255.
https://doi.org/10.1002/ar.1091940206
Weber W, Henry R. 1993: Sheet plastination of body slices - E12 technique, filing method. J Int Soc Plastination 7:16-22.
https://doi.org/10.56507/EZGX2343
Zhang M, An P-C. 2000: Liliequist's membrane is a fold of the arachnoid mater: a study using sheet plastination and scanning electron microscopy. Neurosurgery 47:902-909.
https://doi.org/10.1097/00006123-200010000-00021